![Stock Market Analysis Today [2024.06.27]: S&P 500 at Highs, XLE Crashing, XLK & XLC at All-Time Highs
xlearnonline.com](https://xlearnonline.com/wp-content/uploads/2024/06/Stock-Market-Analysis-10.png)
Hello, Welcome to Stock Market Analysis Today!
- S&P 500: The S&P 500 is in an uptrend and currently at a high level of 550. We expect the price to continue going up.
- Consumer Staples (XLP): XLP is in an uptrend with a medium-term sideways trend.
- Energy (XLE): XLE is crashing, with major support around 88.
- Materials (XLB): XLB broke major support and is moving in a sideways trend, with support around 88.
- Industrials (XLI): XLI is consolidating with support around 120 and resistance at 124 and 126.
- Consumer Discretionary (XLY): XLY is consolidating near resistance at 185.
- Healthcare (XLV): XLV is consolidating around resistance at 148.
- Financials (XLF): XLF broke below major support and is now trading below that level.
- Technology (XLK): XLK is uptrending and at all-time high levels.
- Communications (XLC): XLC is uptrending and at high levels.
- Utilities (XLU): XLU is crashing, with next support around 66.
- Real Estate (XLRE): XLRE is consolidating, pulling back from resistance around 39.
Key Economic Events Today
These events encompass important global news, macroeconomic reports, and economic indicators. For more details, you can check the Bloomberg Calendar.
- At 8:30 AM ET, the GDP (QoQ) data will be released, with a forecast of 1.3% and a previous value of 3.4%.
- At the same time, the Initial Jobless Claims report will come out, with a forecast of 236K and a previous value of 238K.
Stocks with Earnings:
S&P 500
![S&P 500 Stock Market Analysis Today [2024.06.27]
xlearnonline.com](https://xlearnonline.com/wp-content/uploads/2024/06/SPY-D-12.png)
Looking at the S&P 500, it’s in an uptrend and currently at a high level of 550. We can expect the price to continue going up.
![S&P 500 Stock Market Analysis Today [2024.06.27]
xlearnonline.com](https://xlearnonline.com/wp-content/uploads/2024/06/SPY-H-12.png)
Looking at the 1-hour chart, you can see that the price pulled back from the 550 level and is now consolidating. There is support around the 540 level. If the price drops to 540, we can expect a pullback from there and the price to continue going up. If the price breaks below this level, we can expect it to go down to the 532 level. Overall, the market is bullish.
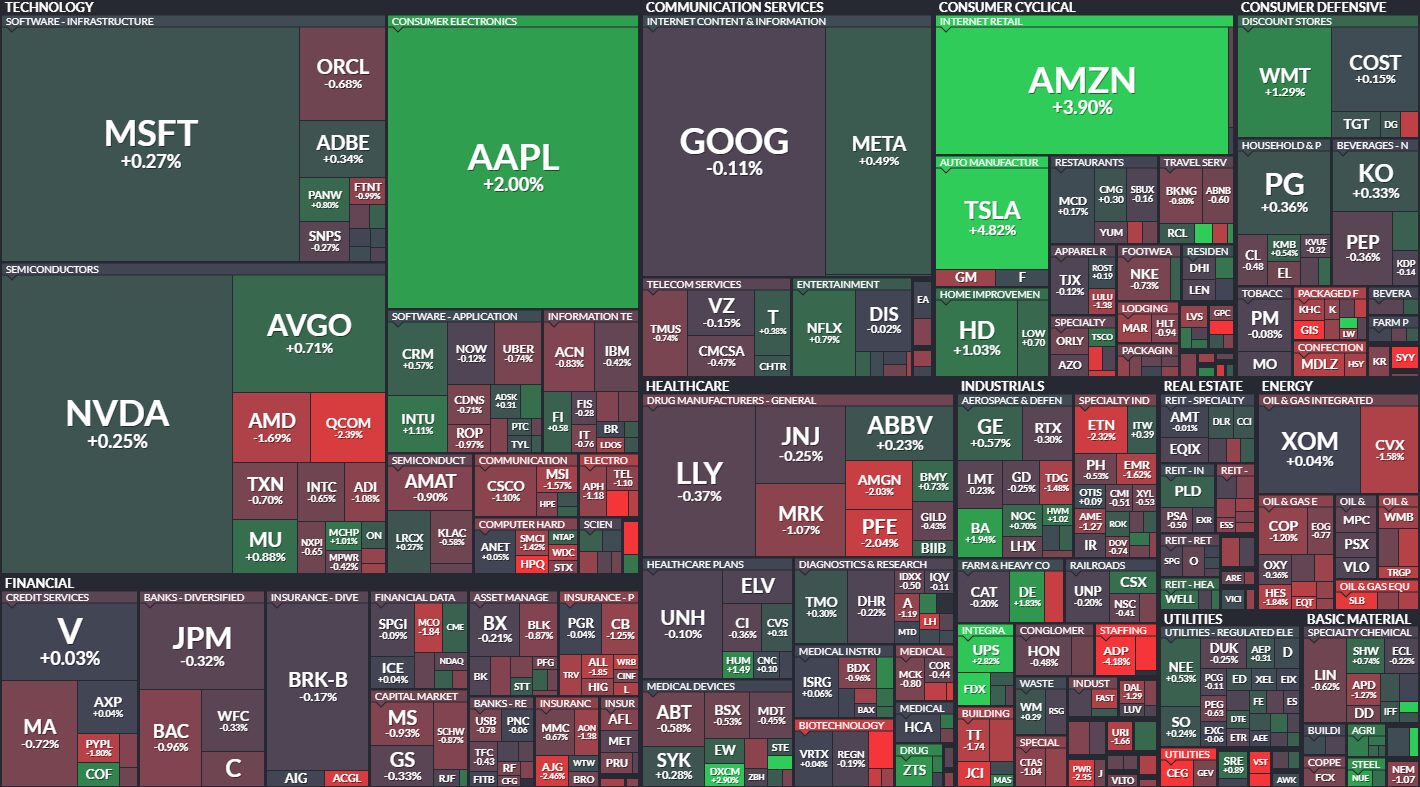
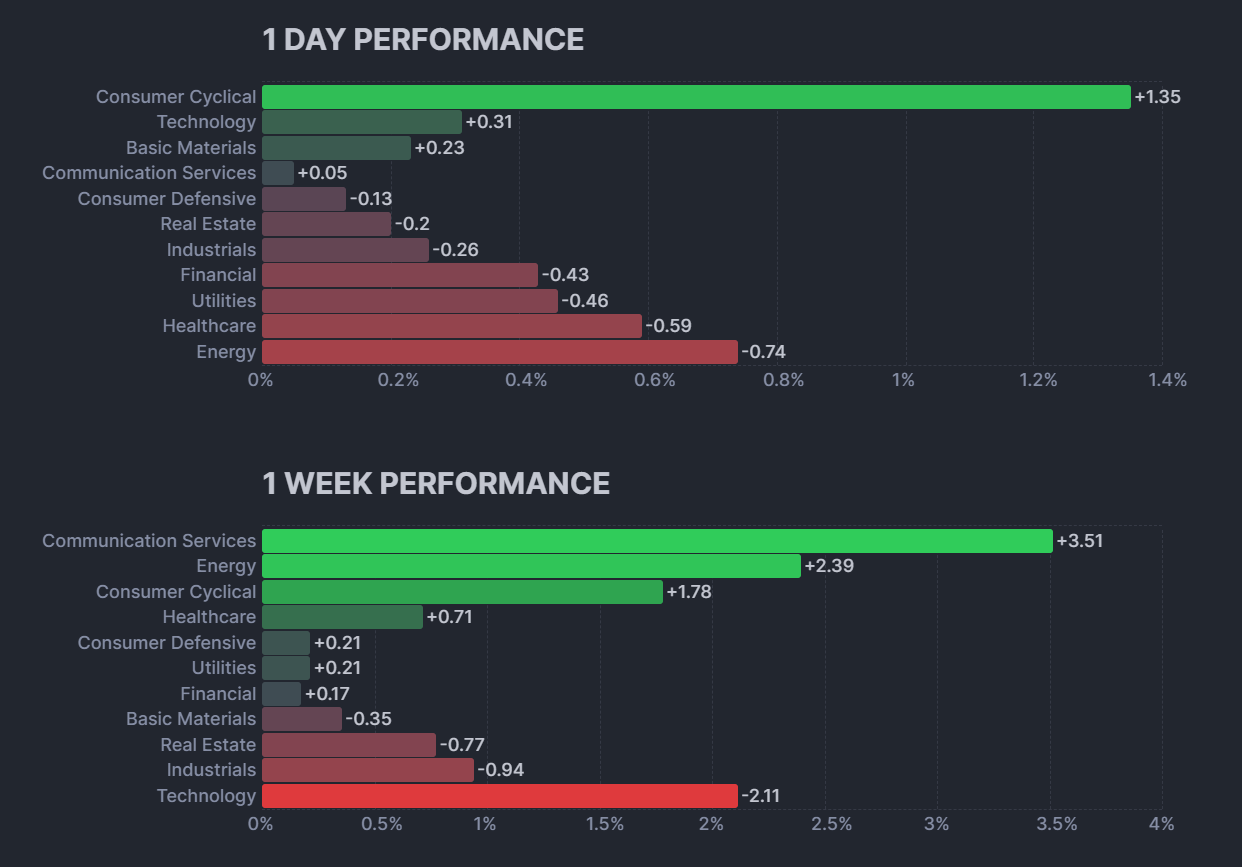
Looking at the heatmap, AMZN gained 3.90%, TSLA rose 4.82%, and AAPL increased by 2%. Sector-wise, technology did well, energy crashed, and financials struggled. It seems like the only sectors that did well are technology and consumer cyclical. Now, let’s look at the actual performance of each sector.
Consumer Staples Sector(XLP):
![XLP Stock Market Analysis Today [2024.06.27]
xlearnonline.com](https://xlearnonline.com/wp-content/uploads/2024/06/XLP-D-11.png)
Looking at XLP, it’s in an uptrend, but there’s also a medium-term sideways trend happening.
![XLP Stock Market Analysis Today [2024.06.27]
xlearnonline.com](https://xlearnonline.com/wp-content/uploads/2024/06/XLP-H-12.png)
Looking at the 1-hour chart, you can see the price is consolidating. If the price drops to around 76.50, we can expect a pullback and the price to continue going up. If the price reaches 78.50, we might also see a pullback there. Keep in mind that if the price breaks either the support at 76.50 or the resistance at 78.50, that’s the direction the price will head next.
Energy Sector(XLE):
![XLE Stock Market Analysis Today [2024.06.27]
xlearnonline.com](https://xlearnonline.com/wp-content/uploads/2024/06/XLE-D-12.png)
Looking at XLE, it’s crashing, and you can clearly see the downtrend in the channel. The major support for the price is around the 88 level.
![XLE Stock Market Analysis Today [2024.06.27]
xlearnonline.com](https://xlearnonline.com/wp-content/uploads/2024/06/XLE-H-12.png)
Looking at the 1-hour chart, you can see the price is near the upper trend line, which acts as resistance. The price might pull back down to the support, or it could break above this level and continue going up. Watch out for a breakout.
Materials Sector(XLB):
![XLB Stock Market Analysis Today [2024.06.27]
xlearnonline.com](https://xlearnonline.com/wp-content/uploads/2024/06/XLB-D-12.png)
Looking at XLP, it broke the major support, and we expect the price to move in a sideways trend. The major support is around the 88 level.
![XLB Stock Market Analysis Today [2024.06.27]
xlearnonline.com](https://xlearnonline.com/wp-content/uploads/2024/06/XLB-H-12.png)
Looking at the 1-hour chart, you can see the price is near the support level. We can expect the price to pull back from this support and go up, or it might break below this level and continue dropping. Watch out for breakouts.
Industrial Sector(XLI):
![XLI Stock Market Analysis Today [2024.06.27]
xlearnonline.com](https://xlearnonline.com/wp-content/uploads/2024/06/XLI-D-12.png)
Looking at XLI, it’s consolidating. The major support is around 120, with resistance at 124 and 126.
![XLI Stock Market Analysis Today [2024.06.27]
xlearnonline.com](https://xlearnonline.com/wp-content/uploads/2024/06/XLI-H-12.png)
Looking at the 1-hour chart, you can see that the price is pulling back from the 124 level and is now near the support around 120. We can expect a pullback at 120 and the price to continue going up. If the price breaks below this level, we can expect it to keep dropping, changing the trend to a downtrend.
Consumer Discretionary Sector(XLY):
![XLY Stock Market Analysis Today [2024.06.27]
xlearnonline.com](https://xlearnonline.com/wp-content/uploads/2024/06/XLY-D-11.png)
Looking at XLY, it’s also consolidating. The price is near the major resistance around 185.
![XLY Stock Market Analysis Today [2024.06.27]
xlearnonline.com](https://xlearnonline.com/wp-content/uploads/2024/06/XLY-H-10.png)
We can expect the price to pull back from that resistance and drop to the 180 level. If the price breaks above that resistance, it will likely continue going up.
Healthcare Sector(XLV):
![XLV Stock Market Analysis Today [2024.06.27]
xlearnonline.com](https://xlearnonline.com/wp-content/uploads/2024/06/XLV-D-10.png)
Looking at XLV, it’s also consolidating, and the price is around the resistance level of 148.
![XLV Stock Market Analysis Today [2024.06.27]
xlearnonline.com](https://xlearnonline.com/wp-content/uploads/2024/06/XLV-H-11.png)
Looking at the 1-hour chart, you can see a small uptrend, and the price is at that level. If the price breaks below this level, we can expect it to continue dropping. Otherwise, the price might pull back from this level and continue going up to the resistance.
Financials Sector(XLF):
![XLF Stock Market Analysis Today [2024.06.27]
xlearnonline.com](https://xlearnonline.com/wp-content/uploads/2024/06/XLF-D-10.png)
Looking at XLF, the price broke below the major support and is now trading below that level.
![XLF Stock Market Analysis Today [2024.06.27]
xlearnonline.com](https://xlearnonline.com/wp-content/uploads/2024/06/XLF-H-11.png)
Looking at the 1-hour chart, the price is pulling back up a bit. If it continues to pull back, it should find resistance around the trend line and start dropping again. If it doesn’t pull back, it will continue dropping from its current level. If the price moves back above the trend line, the trend is still undecided.
Technology Sector(XLK):
![XLK Stock Market Analysis Today [2024.06.27]
xlearnonline.com](https://xlearnonline.com/wp-content/uploads/2024/06/XLK-D-10.png)
Looking at XLK, it’s uptrending and at all-time high levels. We can expect the price to keep going up.
![XLK Stock Market Analysis Today [2024.06.27]
xlearnonline.com](https://xlearnonline.com/wp-content/uploads/2024/06/XLK-H-11.png)
Looking at the 1-hour chart, you can see the price pulled back from a support level. We can expect the price to keep going up, but watch out for breakouts.
Communications Sector(XLC):
![XLC Stock Market Analysis Today [2024.06.27]
xlearnonline.com](https://xlearnonline.com/wp-content/uploads/2024/06/XLC-D-10.png)
Looking at XLC, it’s also uptrending and at high levels. We can expect the momentum to continue.
![XLC Stock Market Analysis Today [2024.06.27]
xlearnonline.com](https://xlearnonline.com/wp-content/uploads/2024/06/XLC-H-11.png)
Looking at the 1-hour chart, you can see support around 85.50. If the price drops to that level, it should pull back and continue going up. Keep in mind, if the price breaks below this level, the upward momentum isn’t strong yet.
Utility Sector(XLU):
![XLU Stock Market Analysis Today [2024.06.27]
xlearnonline.com](https://xlearnonline.com/wp-content/uploads/2024/06/XLU-D-10.png)
Looking at XLU, it’s crashing, with the next support around the 66 level.
![XLU Stock Market Analysis Today [2024.06.27]
xlearnonline.com](https://xlearnonline.com/wp-content/uploads/2024/06/XLU-H-10.png)
Looking at the 1-hour chart, you can see that after the price broke below the support, it pulled back to that level and then started dropping again. This confirms that the 70 level is a strong resistance. We can expect the price to continue dropping to the 66 level.
Real Estate Sector(XLRE):
![XLRE Stock Market Analysis Today [2024.06.27]
xlearnonline.com](https://xlearnonline.com/wp-content/uploads/2024/06/XLRE-D-11.png)
Looking at XLRE, it’s consolidating, and the price is pulling back from the resistance around the 39 level.
![XLRE Stock Market Analysis Today [2024.06.27]
xlearnonline.com](https://xlearnonline.com/wp-content/uploads/2024/06/XLRE-H-11.png)
Looking at the 1-hour chart, you can clearly see the resistance around 39, and the price is currently at a support level. Since it’s consolidating, we can’t be sure which direction the price will go. If the price drops to 36, it should pull back from there. If the price breaks above 39, it should continue going up. If the price breaks below 36, we can expect it to keep dropping.
Conclusion & Disclaimer
Please provide your feedback on how we can improve this article. Thank you!
These analyses are here to help you understand how to analyze the market. They’re not about giving buy or sell signals. It’s simply about observing market behavior. I don’t recommend when to buy or sell because trading doesn’t work that way. You need a strategy to guide your decisions about when to enter or exit positions. That’s the key to making consistent profits in the financial markets over time.
I discussed these sectors and markets because when the entire market or sector goes through certain movements, most of the stocks within that market will also experience similar movements. So, by understanding what the market is doing, you can conduct your own analysis on specific coins or stocks.
The information provided in this market analysis is for educational and informational purposes only. It should not be construed as financial advice or a recommendation to buy, sell, or hold any securities or investments.
All investments involve risk, and past performance is not indicative of future results. The analysis provided may not be suitable for all investors and should be used at their own discretion.
Readers are encouraged to conduct their own research.
Trading and investing in financial markets carry inherent risks, including the risk of losing invested capital. It is important to carefully consider your investment objectives, risk tolerance, and financial situation before making any investment decisions.
GOOD LUCK!!!