![Stock Market Analysis Today [2024.07.09]: Price Action and Stocks to Watch - NVDA, INTC, AMD, TSLA, NKE
xlearnonline.com](https://xlearnonline.com/wp-content/uploads/2024/07/Stock-Market-Analysis-4.png)
Hello, Welcome to Stock Market Analysis Today!
- S&P 500: In an uptrend, likely to reach new highs soon.
- Consumer Staples (XLP): Consolidating but in an uptrend. Watch for price moves from support.
- Energy (XLE): Broke resistance, indicating a potential new uptrend.
- Materials (XLB): In a downtrend after breaking support. Monitor for further drops.
- Industrials (XLI): Consolidating at support. Possible rise toward resistance, but watch for breakouts.
- Consumer Discretionary (XLY): In an uptrend, recently broke major resistance. Expect continued rise.
- Healthcare (XLV): Consolidating, pulling back from resistance. Monitor support levels.
- Financials (XLF): In an uptrend, attempting to recover after breaking support.
- Technology (XLK): Near all-time high, in an uptrend. Watch for resistance levels.
- Communications (XLC): Similar to tech, in an uptrend near high levels.
- Utilities (XLU): Crashing, heading towards the next support level.
- Real Estate (XLRE): Consolidating, moving toward resistance around 38.50. Watch for breakouts.
Stock Market Events Today
These events include important news that could impact the stock market, macroeconomic reports, and economic indicators. For more details, you can check the bloomberg calendar & yahoo finance.
10:00 AM ET: Federal Reserve Chair Jerome Powell is to testify on the economic outlook and recent monetary policy actions before the Joint Economic Committee, in Washington DC. The testimony is in two parts; the first is a prepared statement, then the committee conducts a question and answer session. The Q&A portion of the testimony can see heavy market volatility for the duration.
Stocks with Earnings:
S&P 500
![S&P 500 Market Analysis Today [2024.07.09]
xlearnonline.com](https://xlearnonline.com/wp-content/uploads/2024/07/SPY-D-3.png)
The US stock market is hitting new highs despite the current challenges, holding steady around $555, and the trend remains bullish.
![S&P 500 Market Analysis Today [2024.07.09]
xlearnonline.com](https://xlearnonline.com/wp-content/uploads/2024/07/SPY-H-3.png)
On the 1-hour chart, the price is at an all-time high and facing resistance. If the price breaks above this resistance today, it will likely continue to rise. If not, it will consolidate between 550 and 555. Wait for the resistance to break to confirm the trend.
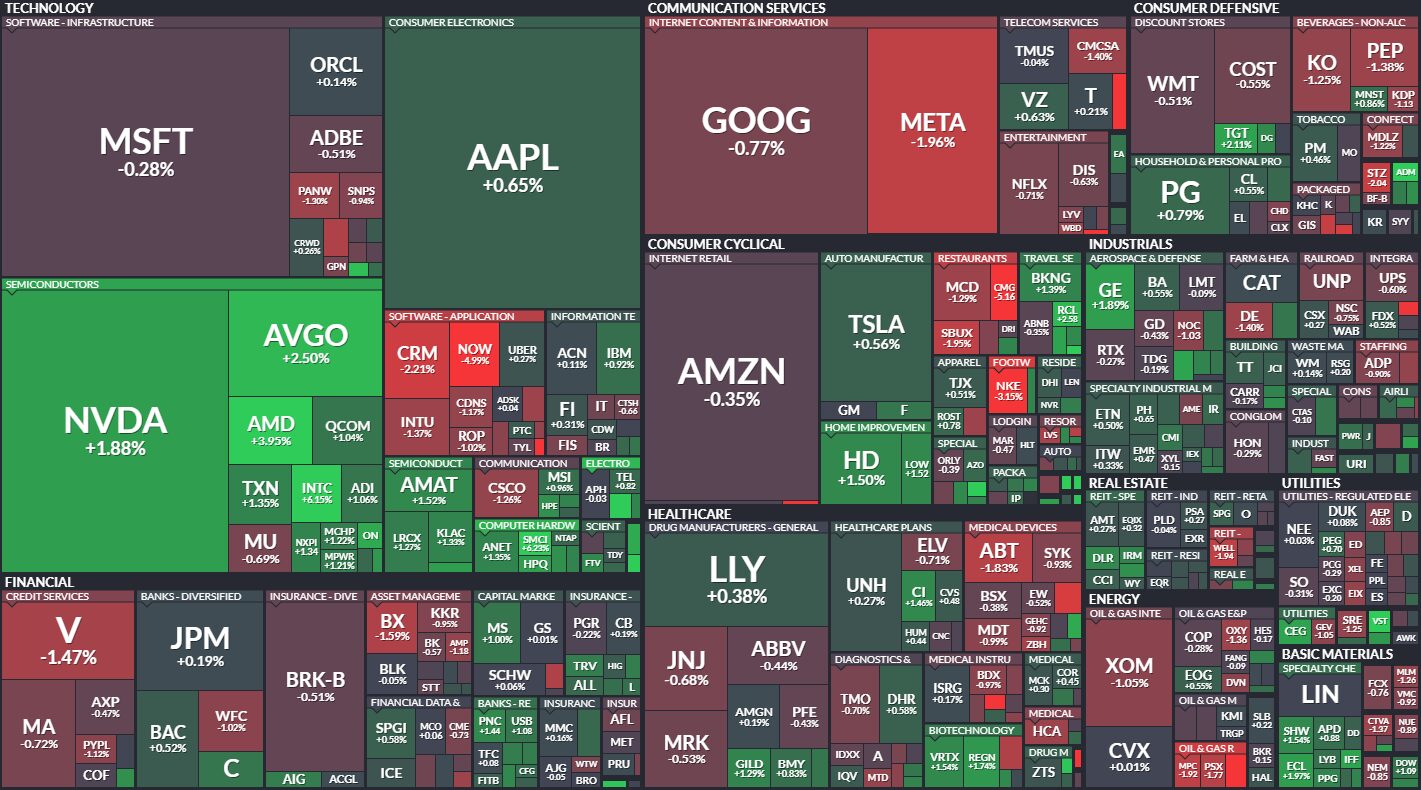
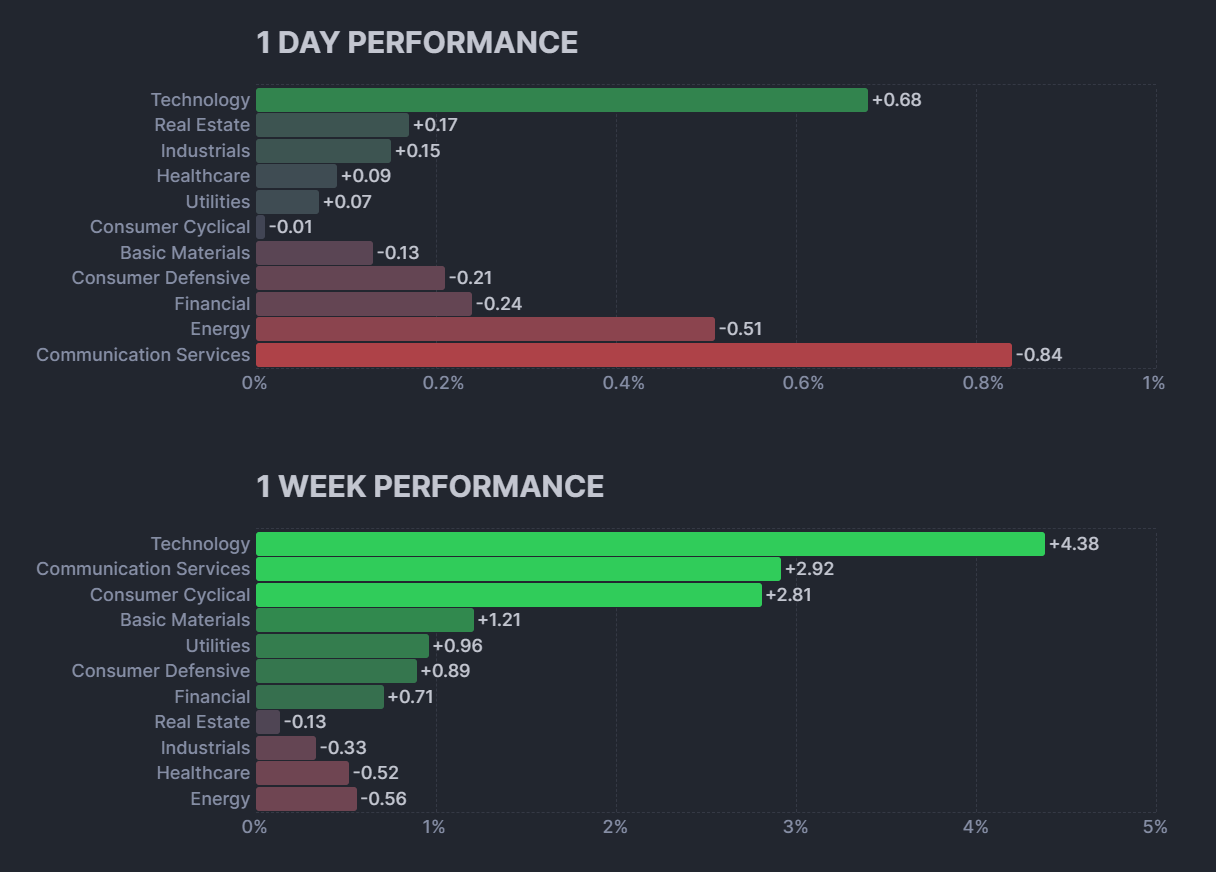
The technology sector is doing well, but everything else is not so good. META is down, NVDA is up, and both AMD and INTC are also up. There’s something happening with INTC that we’ll examine later in the article. Everything else is just neutral. Let’s look at the actual sector performance to get an idea about yesterday’s performance.
Consumer Staples Sector(XLP):
![XLP Sector Analysis Today [2024.07.09]
xlearnonline.com](https://xlearnonline.com/wp-content/uploads/2024/07/XLP-D-3.png)
Looking at the consumer staples sector, it is uptrending, although there’s a medium-term sideways trend happening.
![XLP Sector Analysis Today [2024.07.09]
xlearnonline.com](https://xlearnonline.com/wp-content/uploads/2024/07/XLP-H-3.png)
On the 1-hour chart, you can clearly see the sideways trend. The price is bouncing back from the support level and may rise to the resistance before pulling back. We can only decide on the trend once the price breaks out of this consolidation phase. So, wait for the breakout to confirm the trend.
Energy Sector(XLE):
![XLE Sector Analysis Today [2024.07.09]
xlearnonline.com](https://xlearnonline.com/wp-content/uploads/2024/07/XLE-D-3.png)
Looking at the energy sector, it’s trending down and is near the major support level around 87.
![XLE Sector Analysis Today [2024.07.09]
xlearnonline.com](https://xlearnonline.com/wp-content/uploads/2024/07/XLE-H-3.png)
On the 1-hour chart, you can see that the price broke above the resistance but then went back down, suggesting a false breakout. Now, we can expect the price to continue down to the major support around 87 before pulling back, as the overall trend is still bearish.
Materials Sector(XLB):
![XLB Sector Analysis Today [2024.07.09]
xlearnonline.com](https://xlearnonline.com/wp-content/uploads/2024/07/XLB-D-3.png)
Looking at the materials sector, it’s definitely not in an uptrend. However, it’s unclear whether it’s moving sideways or in a downtrend.
![XLB Sector Analysis Today [2024.07.09]
xlearnonline.com](https://xlearnonline.com/wp-content/uploads/2024/07/XLB-H-3.png)
On the 1-hour chart, you can see that the price pulled back from the support at 86. We can expect this momentum to continue. However, if the price drops below 86, it will confirm that the materials sector is in a downtrend. So, watch for a breakout.
Industrial Sector(XLI):
![XLI Sector Analysis Today [2024.07.09]
xlearnonline.com](https://xlearnonline.com/wp-content/uploads/2024/07/XLI-D-3.png)
Looking at the industrials sector, it’s consolidating. Right now, the price is around the major support level.
![XLI Sector Analysis Today [2024.07.09]
xlearnonline.com](https://xlearnonline.com/wp-content/uploads/2024/07/XLI-H-3.png)
On the 1-hour chart, you can clearly see the sideways trend. The price is bouncing back from the support. We can expect it to reach at least the first resistance shown on the chart before pulling back. However, if the price breaks below the major support level, we can confirm that the industrials sector is in a downtrend.
Consumer Discretionary Sector(XLY):
![XLY Sector Analysis Today [2024.07.09]
xlearnonline.com](https://xlearnonline.com/wp-content/uploads/2024/07/XLY-D-3.png)
Looking at the consumer discretionary sector, it’s leading the pack and is at its all-time high level.
![XLY Sector Analysis Today [2024.07.09]
xlearnonline.com](https://xlearnonline.com/wp-content/uploads/2024/07/XLY-H-3.png)
On the 1-hour chart, we might see a pullback to the support level before continuing up. However, it could also keep going up without pulling back. So, watch for continuation, reversal, and breakout signals as if the price break below the support then the trend may go into correction.
Healthcare Sector(XLV):
![XLV Sector Analysis Today [2024.07.09]
xlearnonline.com](https://xlearnonline.com/wp-content/uploads/2024/07/XLV-D-3.png)
Looking at the healthcare sector, it’s consolidating.
![XLV Sector Analysis Today [2024.07.09]
xlearnonline.com](https://xlearnonline.com/wp-content/uploads/2024/07/XLV-H-3.png)
You can see support and resistance levels on the chart, and the price is trading within them. If the price breaks below support, it will keep going down. If it breaks above resistance, it will go up. The breakout will confirm the trend, so watch for breakouts.
Financials Sector(XLF):
![XLF Sector Analysis Today [2024.07.09]
xlearnonline.com](https://xlearnonline.com/wp-content/uploads/2024/07/XLF-D-3.png)
Looking at the financial sector, it broke the support level and should drop, but it is still trading around that level without dropping.
![XLF Sector Analysis Today [2024.07.09]
xlearnonline.com](https://xlearnonline.com/wp-content/uploads/2024/07/XLF-H-3.png)
On the 1-hour chart, you can see the price is around the resistance levels. We can expect it to start dropping from there, but it is still consolidating. For now, the trend is still unclear for the financial sector.
Technology Sector(XLK):
![XLK Sector Analysis Today [2024.07.09]
xlearnonline.com](https://xlearnonline.com/wp-content/uploads/2024/07/XLK-D-3.png)
Looking at the technology sector, it’s also leading the pack and is at an all-time high level.
![XLK Sector Analysis Today [2024.07.09]
xlearnonline.com](https://xlearnonline.com/wp-content/uploads/2024/07/XLK-H-3.png)
On the 1-hour chart, you can see the price is just above the resistance level. We might see a pullback to that level before it continues up, or it could keep going up without pulling back. Watch for a breakout below the support; if that happens, the trend is changing.
Communications Sector(XLC):
![XLC Sector Analysis Today [2024.07.09]
xlearnonline.com](https://xlearnonline.com/wp-content/uploads/2024/07/XLC-D-3.png)
Looking at the communications sector, it is also at an all-time high level.
![XLC Sector Analysis Today [2024.07.09]
xlearnonline.com](https://xlearnonline.com/wp-content/uploads/2024/07/XLC-H-3.png)
You can see that the price pulled back, found support, and is now consolidating around that level. We can expect the price to start rising from this support level, or it could break below and move to the next support. So, watch for breakout and reversal signals.
Utility Sector(XLU):
![XLU Sector Analysis Today [2024.07.09]
xlearnonline.com](https://xlearnonline.com/wp-content/uploads/2024/07/XLU-D-3.png)
Looking at the utilities sector, it’s trending down.
![XLU Sector Analysis Today [2024.07.09]
xlearnonline.com](https://xlearnonline.com/wp-content/uploads/2024/07/XLU-H-3.png)
On the 1-hour chart, you can clearly see the downtrend. We can expect the price to continue dropping to the major support level. Watch for key levels and breakouts.
Real Estate Sector(XLRE):
![XLRE Sector Analysis Today [2024.07.09]
xlearnonline.com](https://xlearnonline.com/wp-content/uploads/2024/07/XLRE-D-4.png)
Looking at the real estate sector, it’s consolidating.
![XLRE Sector Analysis Today [2024.07.09]
xlearnonline.com](https://xlearnonline.com/wp-content/uploads/2024/07/XLRE-H-4.png)
On the 1-hour chart, you can see the price is between the support and resistance levels. We can only determine the next move after a breakout. So, wait for the breakout to see which direction the price will head next.
Stocks to Watch Today
NVIDIA (NVDA)
![NVDA Stock Analysis Today [2024.07.09]
xlearnonline.com](https://xlearnonline.com/wp-content/uploads/2024/07/NVDA-D.png)
Nvidia is at a resistance level. It seemed to break above it but then went back down. If the price starts trading above this level again, we can expect it to continue rising to the previous high levels.
INTEL (INTC)
![INTC Stock Analysis Today [2024.07.09]
xlearnonline.com](https://xlearnonline.com/wp-content/uploads/2024/07/INTC.png)
Intel, after dropping and being in a consolidation phase for a while, has broken above the resistance, showing buying pressure. We can expect the price to continue rising to the next resistance levels.
AMD (AMD)
![AMD Stock Analysis Today [2024.07.09]
xlearnonline.com](https://xlearnonline.com/wp-content/uploads/2024/07/AMD.png)
AMD is nearing a resistance level. We might see a pullback around this level, or it could follow other semiconductor companies and break above the resistance, continuing to go up. So, wait for the breakout to confirm the trend.
TESLA (TSLA)
![TSLA Stock Analysis Today [2024.07.09]
xlearnonline.com](https://xlearnonline.com/wp-content/uploads/2024/07/TSLA-2.png)
Tesla still looks strong as it nears the resistance level around 270. If it breaks this level, we can expect the price to keep going up. The consumer discretionary sector has shown promising gains, and Tesla, as one of the big players in that sector, is likely to break these resistances and continue its upward momentum with the market.
NIKE (NKE)
![NKE Stock Analysis Today [2024.07.09]
xlearnonline.com](https://xlearnonline.com/wp-content/uploads/2024/07/NKE.png)
Looking at Nike, it dropped significantly, almost as much as during the COVID era. After reporting disappointing fourth-quarter sales and guidance for fiscal 2025, Nike is looking to the Olympic Games next month to help boost sales. Shares of Nike tumbled over 20% to $74.77 in intraday trading on Friday following the news.
Conclusion & Disclaimer
Please provide your feedback on how we can improve this article. Thank you!
We discussed these sectors and markets because when the entire market or sector goes through certain movements, most of the stocks within that market will also experience similar movements. So, by understanding what the market is doing, you can conduct your own analysis on specific stocks.
These analyses are here to help you understand how to analyze the market. They’re not about giving buy or sell signals. It’s simply about observing price action market behavior. I don’t recommend when to buy or sell because trading doesn’t work that way. You need a strategy to guide your decisions about when to enter or exit positions. That’s the key to making consistent profits in the financial markets over time.
The information provided in this market analysis is for educational and informational purposes only. It should not be construed as financial advice or a recommendation to buy, sell, or hold any securities or investments.
All investments involve risk, and past performance is not indicative of future results. The analysis provided may not be suitable for all investors and should be used at their own discretion.
Readers are encouraged to conduct their own research.
Trading and investing in financial markets carry inherent risks, including the risk of losing invested capital. It is important to carefully consider your investment objectives, risk tolerance, and financial situation before making any investment decisions.
GOOD LUCK✌!!!