
![Stock Market Analysis Today [2024.07.11]: S&P 500 Trends, Sector Performances, and Key Stocks to Watch - AMD, Nvidia, Nike, Tesla
xlearnonline.com](https://xlearnonline.com/wp-content/uploads/2024/07/Copy-of-Article-6.png)
Hi, welcome to stock market analysis today!
We will use a top-down approach in our analysis. First, we will analyze the overall market, focusing on the S&P 500. Then, we will analyze each sector one by one for their price action performance, so we can trade stocks in those sectors with confidence. Finally, we will look at some stocks to watch today.
Here’s a quick summary if you’re in a hurry:
- S&P 500: In an uptrend and at an all-time high. We can expect this momentum to continue.
- Consumer Staples (XLP): Trending up even though there’s a medium-term sideways trend.
- Energy (XLE): Trending down and near a major support level.
- Materials (XLB): Broke support, so it should be in a downtrend or sideways trend.
- Industrials (XLI): Consolidating, with the price near the support level.
- Consumer Discretionary (XLY): Trending up and at an all-time high.
- Healthcare (XLV): Consolidating, with the price nearing the resistance level.
- Financials (XLF): Broke support but still looks bullish.
- Technology (XLK): Trending up and at an all-time high.
- Communications (XLC): Trending up and at an all-time high.
- Utilities (XLU): Was trending down, but now pulling back up.
- Real Estate (XLRE): Consolidating.
Economic Events Today
These events include important news that could impact the stock market, macroeconomic reports, and economic indicators. For more details, you can check the bloomberg calendar & yahoo finance.
8:30 ET: CPI (YoY) release, with a forecast of 3.1% and a previous value of 3.3%. The Consumer Price Index (CPI) shows how prices for goods and services have changed over time and measures inflation. The Central Bank watches this number closely to keep prices stable. If the CPI is higher than expected, it’s usually good (bullish) for the USD. If it’s lower than expected, it’s usually bad (bearish) for the USD.
At the same time, the Initial Jobless Claims report will be released, with a forecast of 236K and a previous value of 238K. Initial Jobless Claims measure the number of people who filed for unemployment benefits for the first time last week. This is the most current U.S. economic data, but its market impact can change weekly. If the number is higher than expected, it’s usually bad (bearish) for the USD. If it’s lower than expected, it’s usually good (bullish) for the USD.
13:00 ET: 30-Year Bond Auction with a previous yield of 4.403%. This auction shows the yield on the Treasury Bond being sold. U.S. Treasury Bonds have maturities from 10 to 30 years. The government issues these bonds to borrow money, covering the gap between tax income and spending, refinancing debt, or raising capital. The bond’s rate is the return investors get if they hold it for its full term. All bidders receive the same rate at the highest accepted bid. Watching yield changes can indicate the government debt situation. Investors compare the auction rate to previous rates for the same bond.
Stocks with Earnings
S&P 500
![S&P 500 Analysis Today [2024.07.11]
xlearnonline.com](https://xlearnonline.com/wp-content/uploads/2024/07/SPY-D-5.png)
Looking at the S&P 500, it’s in an uptrend and at an all-time high. We can expect this momentum to continue.
![S&P 500 Analysis Today [2024.07.11]
xlearnonline.com](https://xlearnonline.com/wp-content/uploads/2024/07/SPY-H-5.png)
Looking at the 1-hour chart, you can see that the price is steadily climbing. Since the overall trend is bullish, we can expect it to continue. However, pullbacks are good for maintaining momentum, so expect some pullbacks around round numbers.
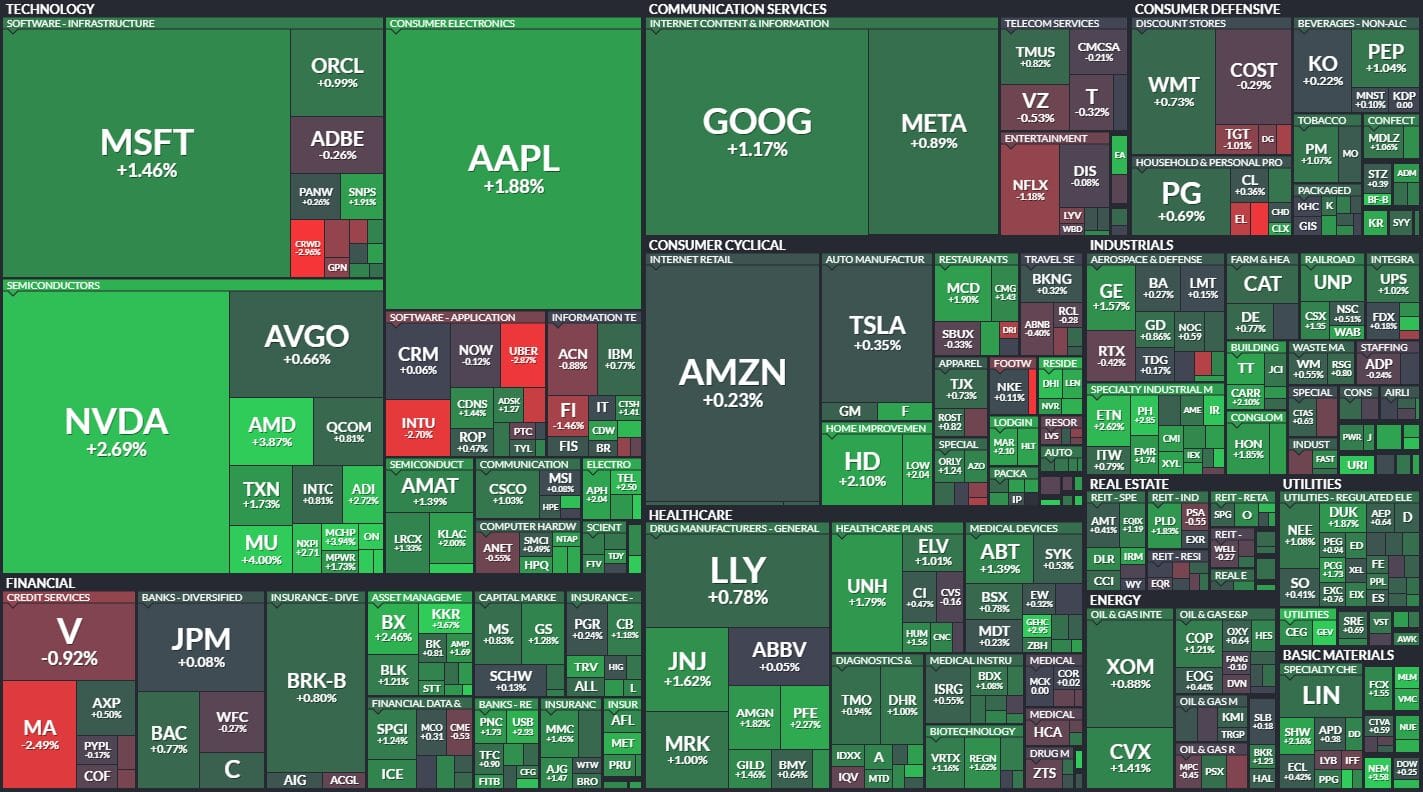
Looking at the heatmap, almost all sectors and stocks are up. The financial sector is struggling but still up, and energy is also up after being in a downtrend. For stocks, UBER is down, INTU dropped after giving out dividends, and Mastercard (MA) experienced some losses. Now, let’s look at yesterday’s sector performance.
Consumer Staples Sector(XLP):
![XLP Analysis Today [2024.07.11]
xlearnonline.com](https://xlearnonline.com/wp-content/uploads/2024/07/XLP-D-5.png)
Looking at the consumer staples sector, it’s trending up even though there’s a medium-term sideways trend happening.
![XLP Analysis Today [2024.07.11]
xlearnonline.com](https://xlearnonline.com/wp-content/uploads/2024/07/XLP-H-6.png)
Looking at the 1-hour chart, you can see that the price pulled back from the support, went to a resistance level, then pulled back and consolidated a bit. Now, it’s trying to get back above the resistance line. If the price breaks above this resistance, we can expect it to continue going up, or it could pull back from this level. Watch for breakout and reversal signals.
Energy Sector(XLE):
![XLE Analysis Today [2024.07.11]
xlearnonline.com](https://xlearnonline.com/wp-content/uploads/2024/07/XLE-D-5.png)
Looking at the energy sector, it’s trending down and is near a major support level.
![XLE Analysis Today [2024.07.11]
xlearnonline.com](https://xlearnonline.com/wp-content/uploads/2024/07/XLE-H-5.png)
In the 1-hour chart, you can see that the price is pulling back up from the support level. It touched the major support level before breaking above the resistance and then dropping back. A new trend might have started, so we can expect the price to go up from this support. However, if the price breaks below this support, it may find support around the major support level and pull back. Keep an eye on it.
Materials Sector(XLB):
![XLB Analysis Today [2024.07.11]
xlearnonline.com](https://xlearnonline.com/wp-content/uploads/2024/07/XLB-D-5.png)
Looking at the materials sector, it broke the support, so it should be in a downtrend or a sideways trend.
![XLB Analysis Today [2024.07.11]
xlearnonline.com](https://xlearnonline.com/wp-content/uploads/2024/07/XLB-H-5.png)
Looking at the 1-hour chart, you can see that after reaching the support, the price is going on an upward trend. Now, the price is nearing a resistance level. If the price breaks above this resistance, we can expect it to continue going up. However, the price could also pull back from that level and start dropping. So, wait for a breakout or reversal signal to confirm the direction.
Industrial Sector(XLI):
![XLI Analysis Today [2024.07.11]
xlearnonline.com](https://xlearnonline.com/wp-content/uploads/2024/07/XLI-D-5.png)
Looking at the industrials sector, it’s consolidating, and the price is near the support level.
![XLI Analysis Today [2024.07.11]
xlearnonline.com](https://xlearnonline.com/wp-content/uploads/2024/07/XLI-H-5.png)
Looking at the 1-hour chart, you can see that after the price reached the major support, it pulled back and is now at a resistance. If the price breaks above this resistance, we can expect it to continue up to the next resistance. If that is also broken, it will go to the next level. Since it’s consolidating, a breakout is likely. So, watch for the price breaking below the support.
Consumer Discretionary Sector(XLY):
![XLY Analysis Today [2024.07.11]
xlearnonline.com](https://xlearnonline.com/wp-content/uploads/2024/07/XLY-D-5.png)
Looking at the consumer discretionary sector, it’s trending up and is at an all-time high.
![XLY Analysis Today [2024.07.11]
xlearnonline.com](https://xlearnonline.com/wp-content/uploads/2024/07/XLY-H-5.png)
The trend still looks strong on the 1-hour chart. Watch for round numbers, as they often act as support and resistance levels. Overall, the trend is bullish.
Healthcare Sector(XLV):
![XLV Analysis Today [2024.07.11]
xlearnonline.com](https://xlearnonline.com/wp-content/uploads/2024/07/XLV-D-5.png)
Looking at the healthcare sector, it’s consolidating, and the price is nearing the resistance level.
![XLV Analysis Today [2024.07.11]
xlearnonline.com](https://xlearnonline.com/wp-content/uploads/2024/07/XLV-H-5.png)
Now you can see the price heading to a resistance level. We can expect a pullback there, or the price could break above and continue to the next resistance. Watch for both reversal and breakout signals.
Financials Sector(XLF):
![XLF Analysis Today [2024.07.11]
xlearnonline.com](https://xlearnonline.com/wp-content/uploads/2024/07/XLF-D-5.png)
Looking at the financial sector, it broke the support but still looks bullish.
![XLF Analysis Today [2024.07.11]
xlearnonline.com](https://xlearnonline.com/wp-content/uploads/2024/07/XLF-H-5.png)
You can see that the price is getting squeezed between support and resistance levels. If the price breaks above the resistance, we can expect it to keep going up, marking the sector as uptrend. However, if it breaks below the support, it will mark the sector as downtrend. So, wait for the breakout to determine the trend.
Technology Sector(XLK):
![XLK Analysis Today [2024.07.11]
xlearnonline.com](https://xlearnonline.com/wp-content/uploads/2024/07/XLK-D-5.png)
Looking at the technology sector, it’s trending up and is at an all-time high.
![XLK Analysis Today [2024.07.11]
xlearnonline.com](https://xlearnonline.com/wp-content/uploads/2024/07/XLK-H-5.png)
Looking at the 1-hour chart, the price pulled back to a support and started going up, so we can expect this momentum to continue. However, if the price comes back and breaks below this support, the trend might be changing. Watch for that, but overall, the trend is bullish.
Communications Sector(XLC):
![XLC Analysis Today [2024.07.11]
xlearnonline.com](https://xlearnonline.com/wp-content/uploads/2024/07/XLC-D-5.png)
The same goes for the communications sector; it’s trending up and at an all-time high.
![XLC Analysis Today [2024.07.11]
xlearnonline.com](https://xlearnonline.com/wp-content/uploads/2024/07/XLC-H-5.png)
Looking at the 1-hour chart, you can see that the price is at a resistance. If the price breaks above this resistance, which is likely, we can expect the upward momentum to continue. Otherwise, it could pull back to the support level.
Utility Sector(XLU):
![XLU Analysis Today [2024.07.11]
xlearnonline.com](https://xlearnonline.com/wp-content/uploads/2024/07/XLU-D-5.png)
Looking at the utilities sector, it was trending down, but now it’s pulling back up.
![XLU Analysis Today [2024.07.11]
xlearnonline.com](https://xlearnonline.com/wp-content/uploads/2024/07/XLU-H-5.png)
Looking at the 1-hour chart, you can see the price pulling back from a support level and nearing a resistance level. We can expect the price to reach this resistance, then either pull back and start dropping or break above and continue going up. Watch for both reversal and breakout signals.
Real Estate Sector(XLRE):
![XLRE Analysis Today [2024.07.11]
xlearnonline.com](https://xlearnonline.com/wp-content/uploads/2024/07/XLRE-D-6.png)
Looking at the real estate sector, it’s consolidating.
![XLRE Analysis Today [2024.07.11]
xlearnonline.com](https://xlearnonline.com/wp-content/uploads/2024/07/XLRE-H-6.png)
Looking at the 1-hour chart, it seems the price broke above the resistance. We can expect the price to reach the next major resistance and possibly pull back, or it could break above that resistance and continue rising to higher levels.
Stocks to Watch Today
AMD(AMD):
![AMD Stock Analysis Today [2024.07.11]
xlearnonline.com](https://xlearnonline.com/wp-content/uploads/2024/07/AMD-1.png)
AMD plans to acquire Silo AI to expand its enterprise AI solutions globally. After this announcement, the stock started to rise. Now, the price is at a resistance level. If the stock trades above this resistance today, we can expect it to continue going up with the overall market.
NVIDIA(NVDA):
![Nvidia Stock Analysis Today [2024.07.11]
xlearnonline.com](https://xlearnonline.com/wp-content/uploads/2024/07/NVDA-2.png)
Looking at Nvidia, it’s steadily climbing, with the market making all-time highs. Nvidia plays an important role in the chip market, so it’s normal if Nvidia reaches new highs in the coming days. Now, looking at the price action, the price is nearing a resistance level. We can expect a pullback, but it could also break above and keep going up.
NIKE(NKE):
![NIKE Stock Analysis Today [2024.07.11]
xlearnonline.com](https://xlearnonline.com/wp-content/uploads/2024/07/NKE-1.png)
Looking at Nike, it’s reaching a major support level. We should see a pullback here and the price starting to go up. But if the price breaks below this support, it’s more likely to keep dropping. I mentioned this stock to keep you aware of what’s going on with Nike. The short float is only 1.94%, and the short ratio is 1.74, so short sellers can recover their positions in just 2 days at the current volume. This makes a stock squeeze unlikely. However, since the overall market is going up, this stock should also start picking up. After all, Nike is your favorite sneaker company.
TESLA(TSLA):
![TESLA Stock Analysis Today [2024.07.11]
xlearnonline.com](https://xlearnonline.com/wp-content/uploads/2024/07/TSLA-4.png)
Looking at Tesla, it’s in an uptrend and at a resistance level. If the price breaks above this resistance today, we can expect it to keep going up. However, it could also pull back from this level. With earnings coming up, the market might be reacting to that information, so keep an eye on it.
Conclusion & Disclaimer
Please provide your feedback on how we can improve this article. Thank you!
We discussed these sectors and markets because when the entire market or sector goes through certain movements, most of the stocks within that market will also experience similar movements. So, by understanding what the market is doing, you can conduct your own analysis on specific stocks.
These analyses are here to help you understand how to analyze the market. They’re not about giving buy or sell signals. It’s simply about observing price action market behavior. I don’t recommend when to buy or sell because trading doesn’t work that way. You need a strategy to guide your decisions about when to enter or exit positions. That’s the key to making consistent profits in the financial markets over time.
The information provided in this market analysis is for educational and informational purposes only. It should not be construed as financial advice or a recommendation to buy, sell, or hold any securities or investments.
All investments involve risk, and past performance is not indicative of future results. The analysis provided may not be suitable for all investors and should be used at their own discretion.
Readers are encouraged to conduct their own research.
Trading and investing in financial markets carry inherent risks, including the risk of losing invested capital. It is important to carefully consider your investment objectives, risk tolerance, and financial situation before making any investment decisions.
GOOD LUCK✌!!!