
![Market Analysis Today[2024.04.01]: Heading for Another Bull Run?
xlearnonline.com](https://xlearnonline.com/wp-content/uploads/2024/04/market-analysis-today.jpg)
It’s April 1st, 2024, let’s not get fooled by the market today. let’s begin our market analysis today journey together.
Key Events Today
Nothing big, we have Manufacturing PMI coming out this morning.
And, These stocks have earnings today.
Forex
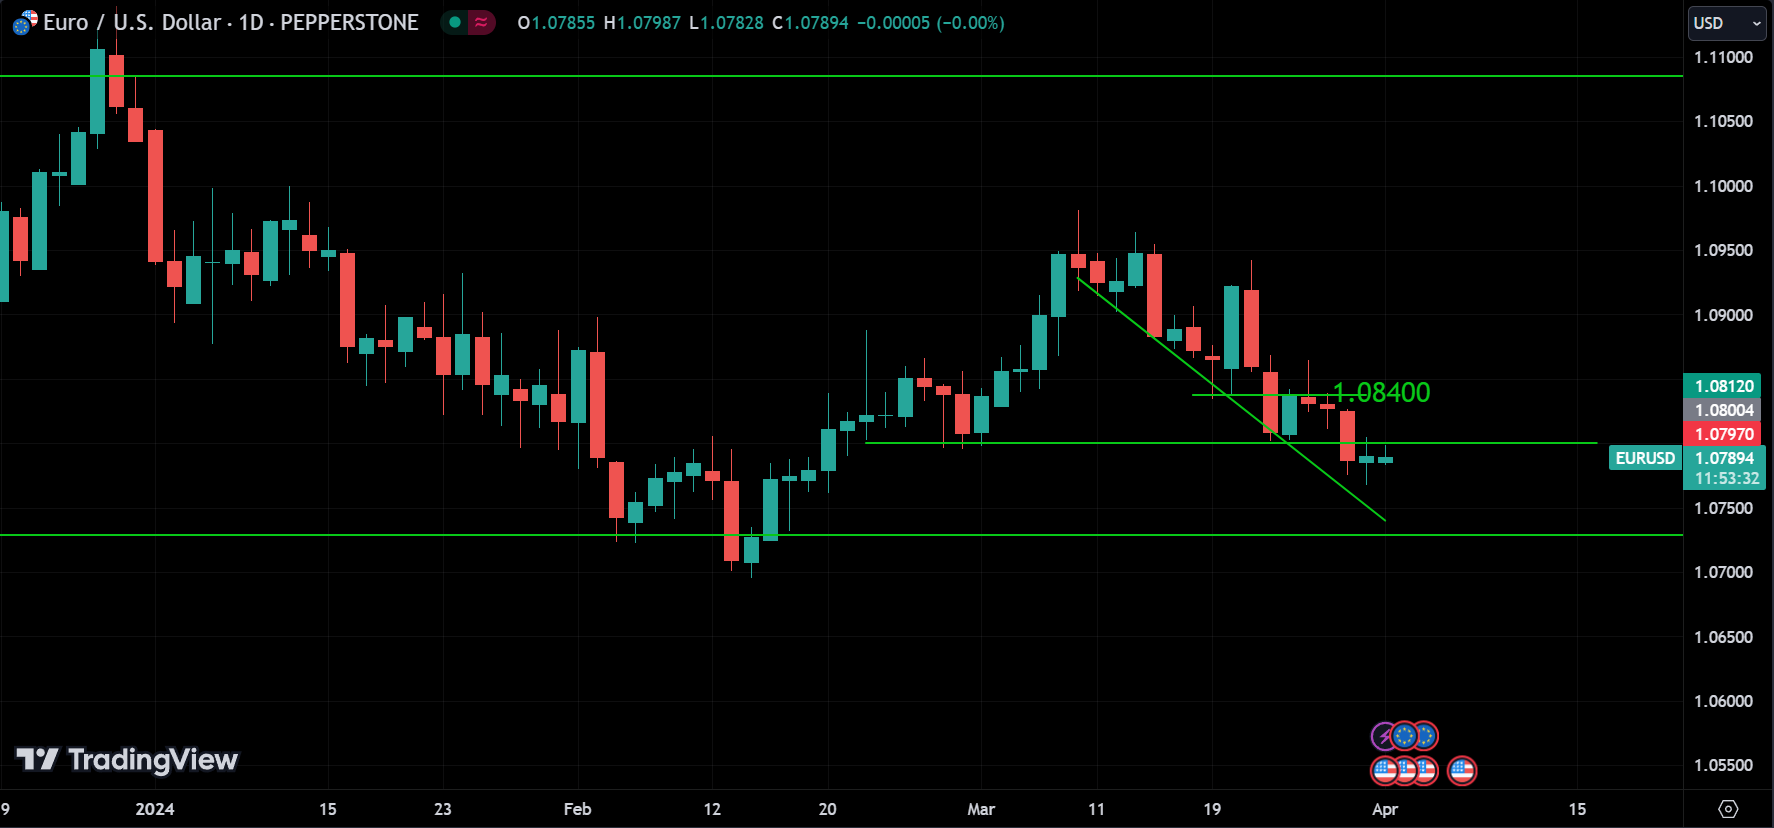
It looks like the price broke the 1.08400 level, went up, then came back down, breaking the last support level. This indicates that EURUSD is currently on a downtrend. The next support is approximately between the 1.07500 and 1.07000 levels.
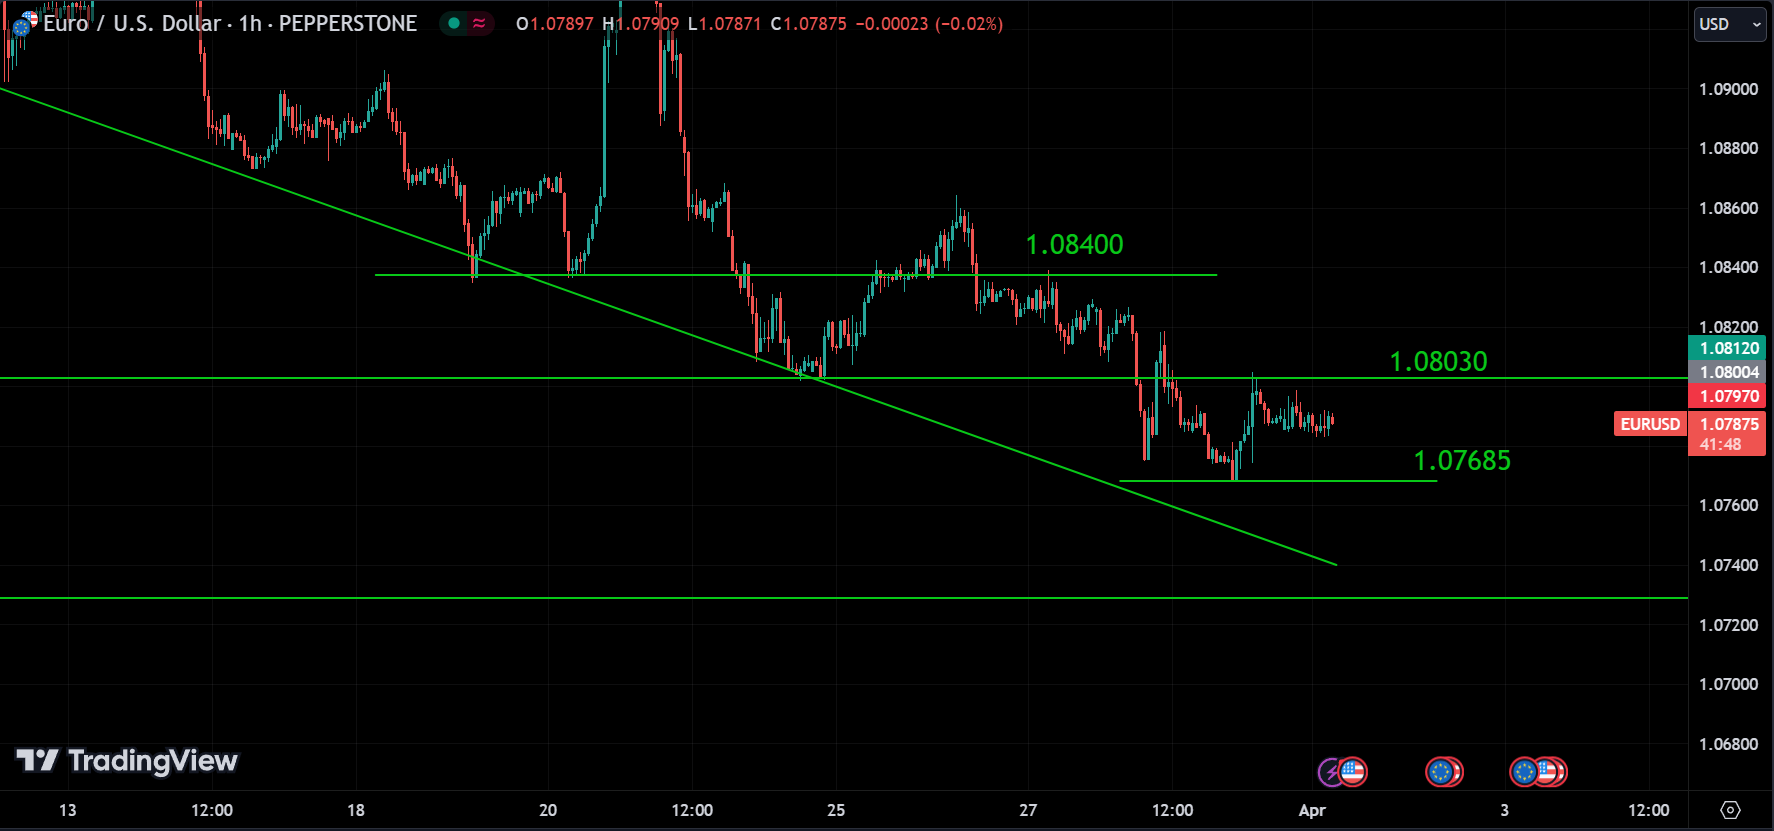
If we look at the 1-hour chart, we can see that the range around 1.08030 is now acting as a new resistance level for the price. If the price breaks above this level, it could indicate a bullish trend for a while. However, overall, the trend is currently bearish. The next support level we can anticipate is around 1.07685, or as mentioned earlier, between 1.07500 and 1.07000. If the price breaks below 1.07685, we can expect it to reach the range of 1.07500 to 1.07000. Therefore, it’s advisable to wait for a breakout to confirm the trend, but overall, the market sentiment is bearish.
Stocks
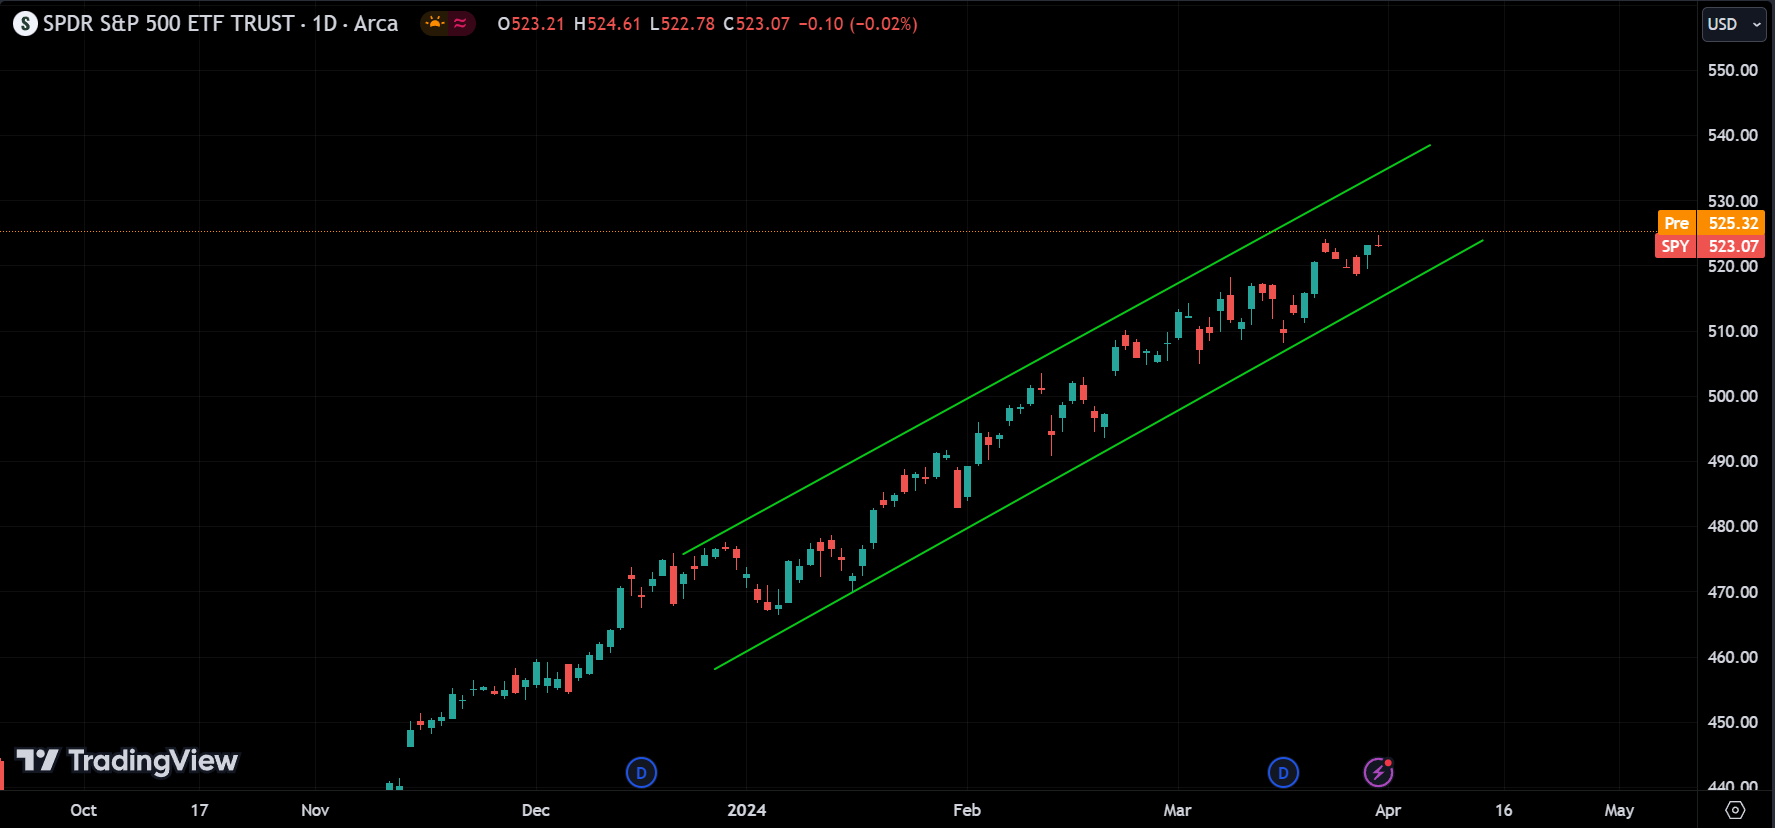
Regarding the S&P 500, despite the recent bearishness in the past few days, the overall market trend remains bullish. The channel has not been broken, indicating that we can anticipate the market to continue making new highs.
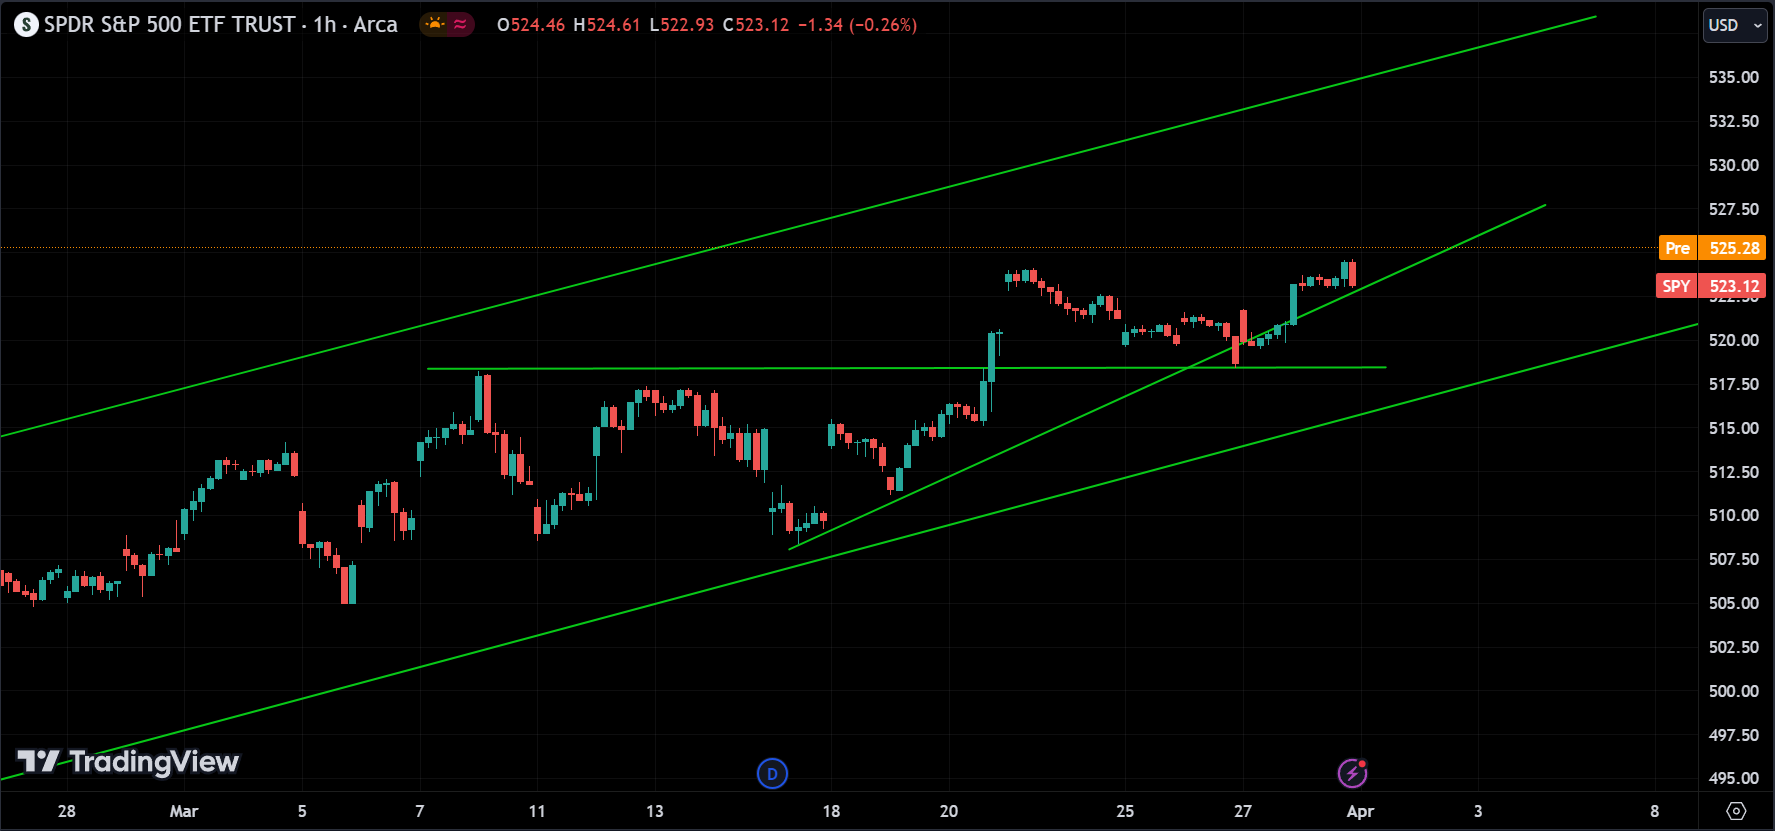
It appears that the market has already reached a peak before undergoing a correction. There’s also a noticeable strong support level around the $518 range. If the price falls below this level, we should be prepared for a bearish signal, but we need to wait until the channel breaks to confirm. If it doesn’t break, the trend remains bullish. Overall, the market sentiment is bullish.

The market is mostly green, with Tesla down by 2.25%, Apple down by 1%, and Meta also experiencing a decline. However, overall, most other sectors are performing decently. The semiconductor industry is doing particularly well as expected, with companies like Nvidia showing strength. However, Micron (MU) is down, possibly indicating a correction after a period of significant growth.
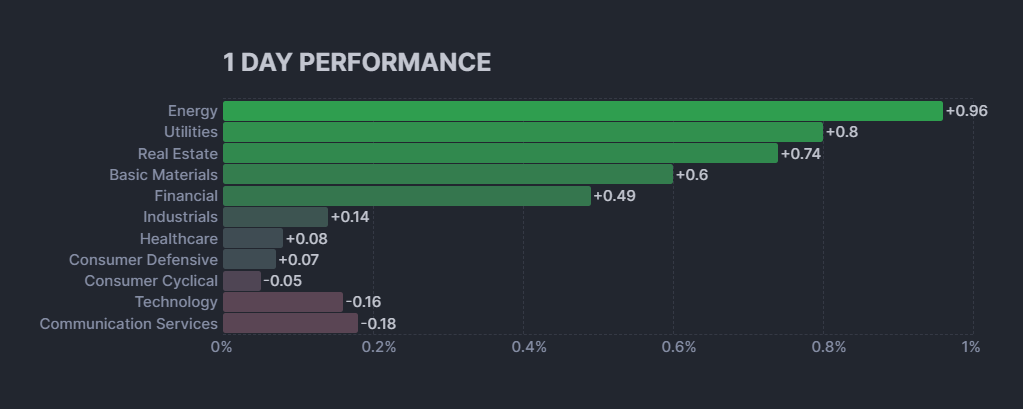
The overall performance of the sectors is positive. Eight out of the eleven sectors show positive performance. The Energy sector performed the best with a one-day performance of 0.96%. Conversely, the Communication Services sector performed the worst with a one-day performance of -0.18%.
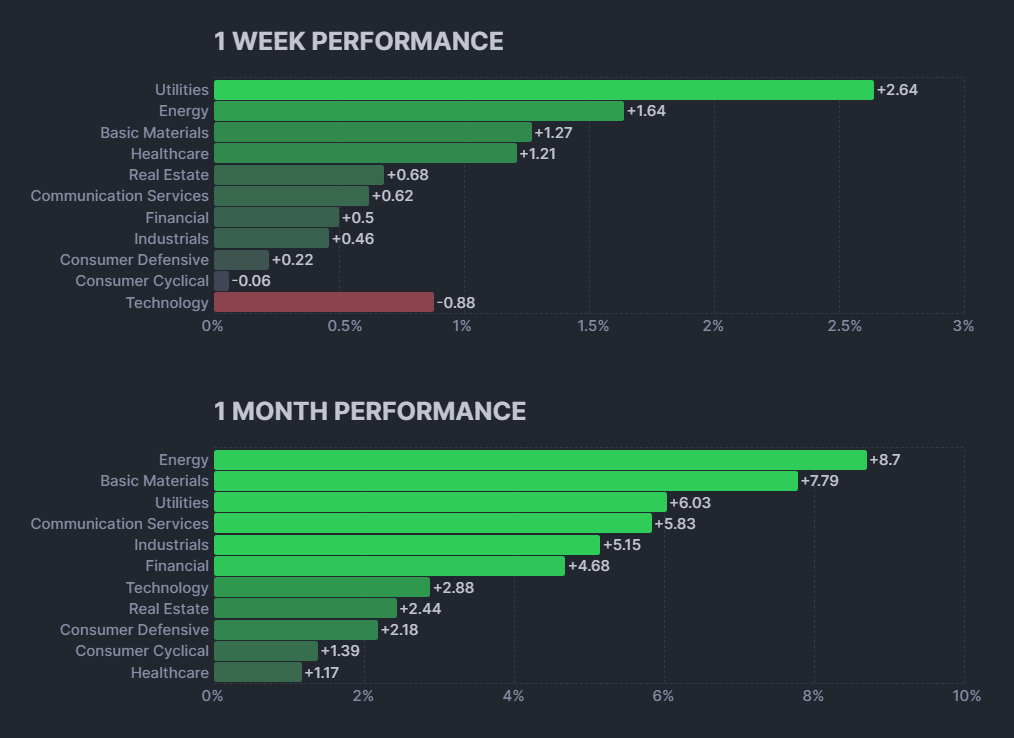
The Energy sector has the strongest performance across both the one-week and one-month periods. Over the past week, the Energy sector increased by 1.64%. This is more than double the gains of the second-best performing sector, Utilities, which grew by 2.64% over the week. The Energy sector’s strong one-week performance is followed by even stronger gains over the past month. The Energy sector increased by 7.79% over the month, and further grew to 8.7% by the close on March 28th, 2024.
Several other sectors also showed positive performance over the past month. The Utilities sector grew by 5.83% over the month, reaching 6.03% by the end of March. The Basic Materials sector also performed well, increasing by 5.15% over the past month.
Conversely, the Technology sector has the weakest overall performance. Over the past week, the Technology sector decreased by 0.88%. This is the only sector with a negative return over the past week. The Technology sector partially recovered over the past month, increasing by 2.88%. However, this is still the smallest gain of any sector over the past month.
Overall, a positive week and month for the stock market, with most sectors experiencing growth. The Energy sector stands out for its exceptional performance across both timeframes.
Crypto
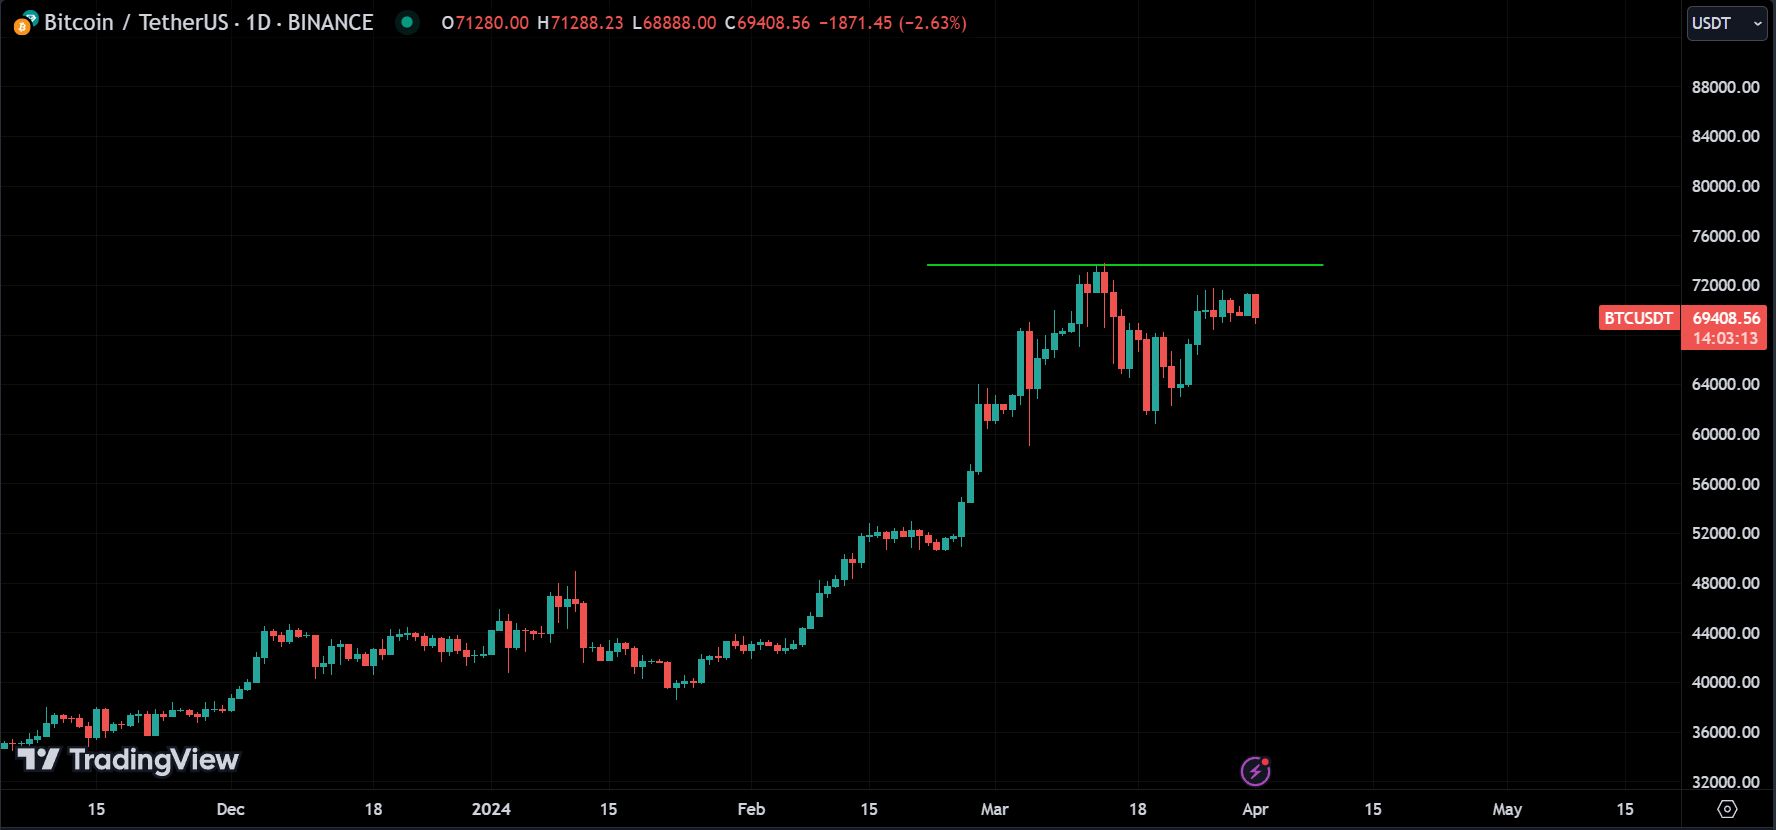
BTC is still demonstrating a bullish trend, as expected. It has recently reached a new high after several years, and historically, each time it surpasses its previous high, the price tends to surge. Therefore, we can anticipate a similar pattern this time as well. Currently, it’s trading around $69,400 at the time of writing.
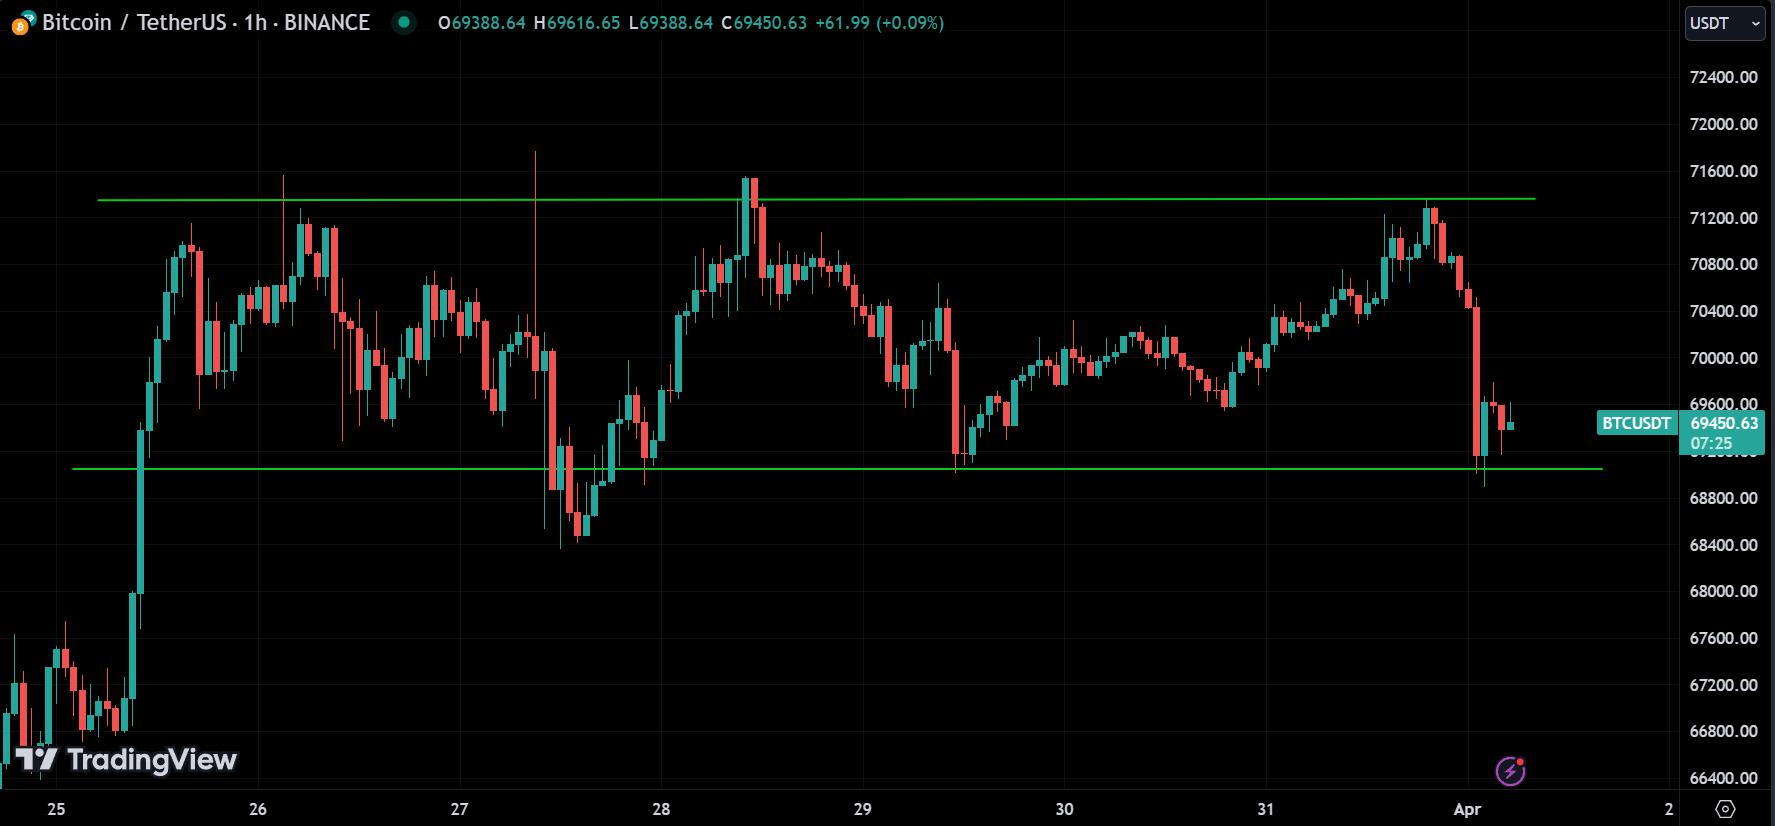
You can observe that the price is currently moving sideways, indicating that it’s consolidating before making a decisive move in its previous direction. At this juncture, we anticipate a breakout to the upside, with the potential for the price to reach $74,000 directly upon breaking out. However, it’s crucial to wait for confirmation of the breakout. Conversely, if it breaks below, it suggests that the price is likely headed for a correction or pullback.
Overall Crypto is Bullish.
Disclaimer
The information provided in this market analysis is for educational and informational purposes only. It should not be construed as financial advice or a recommendation to buy, sell, or hold any securities or investments.
All investments involve risk, and past performance is not indicative of future results. The analysis provided may not be suitable for all investors and should be used at their own discretion.
Readers are encouraged to conduct their own research.
Trading and investing in financial markets carries inherent risks, including the risk of losing invested capital. It is important to carefully consider your investment objectives, risk tolerance, and financial situation before making any investment decisions.