
![Market Analysis Today[2024.04.03]
xlearnonline.com](https://xlearnonline.com/wp-content/uploads/2024/04/Market-Analysis-Today2024.04.04.jpg)
It’s Thursday, 4th of April. Let’s Dive into our Financial Market Analysis Today.
Key Events Today
We have Unemployment Claims and Speech from FOMC.
These Stocks have earnings today.
Forex
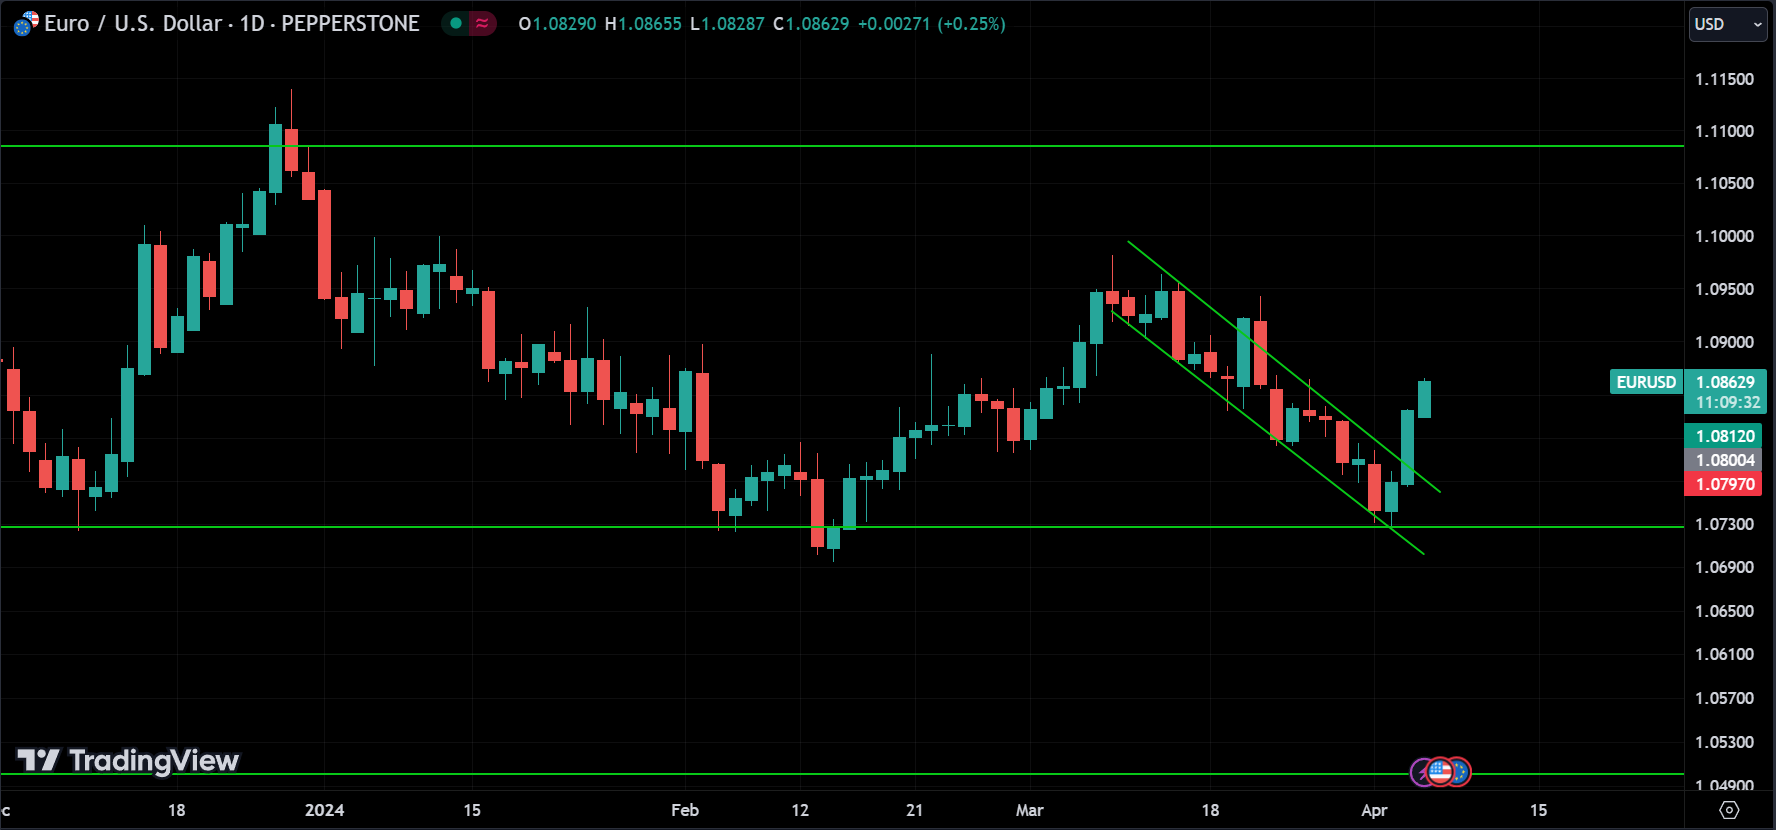
About EURUSD, Now we can say that the medium-term downward trend is finished because the price broke out of the downtrend channel and is now moving upwards strongly. There might be a few corrections along the way, but overall, the trend is bullish.
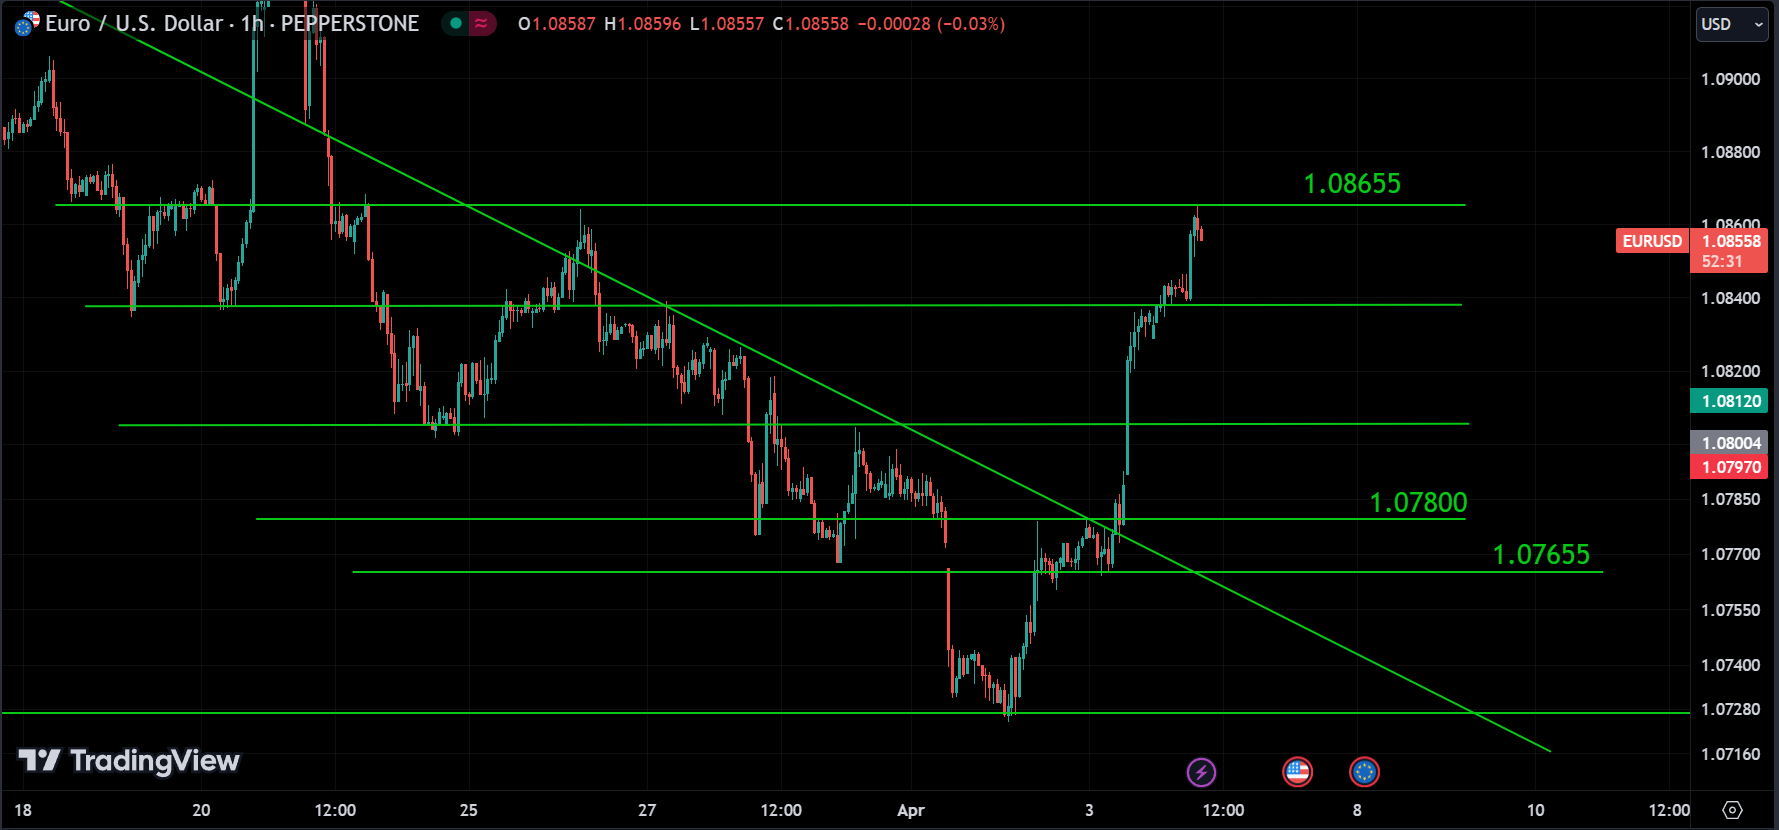
At the time of writing, the price was trading near its strongest resistance level 1.08655. If it manages to break through this barrier, we can anticipate further upward momentum, or alternatively, there might be a strong price correction.
All these horizontal lines act as support levels for the price, but 1.07800 and 1.07655 are the strongest ones. It’s unlikely that the price will break these levels since it recently broke out from them to move upward.
So, what we can anticipate now is either a continuation of the upward trend if it surpasses 1.08655, or the price might undergo a correction.
Stock
For those who read our market analysis yesterday, this smile is for you 😁.
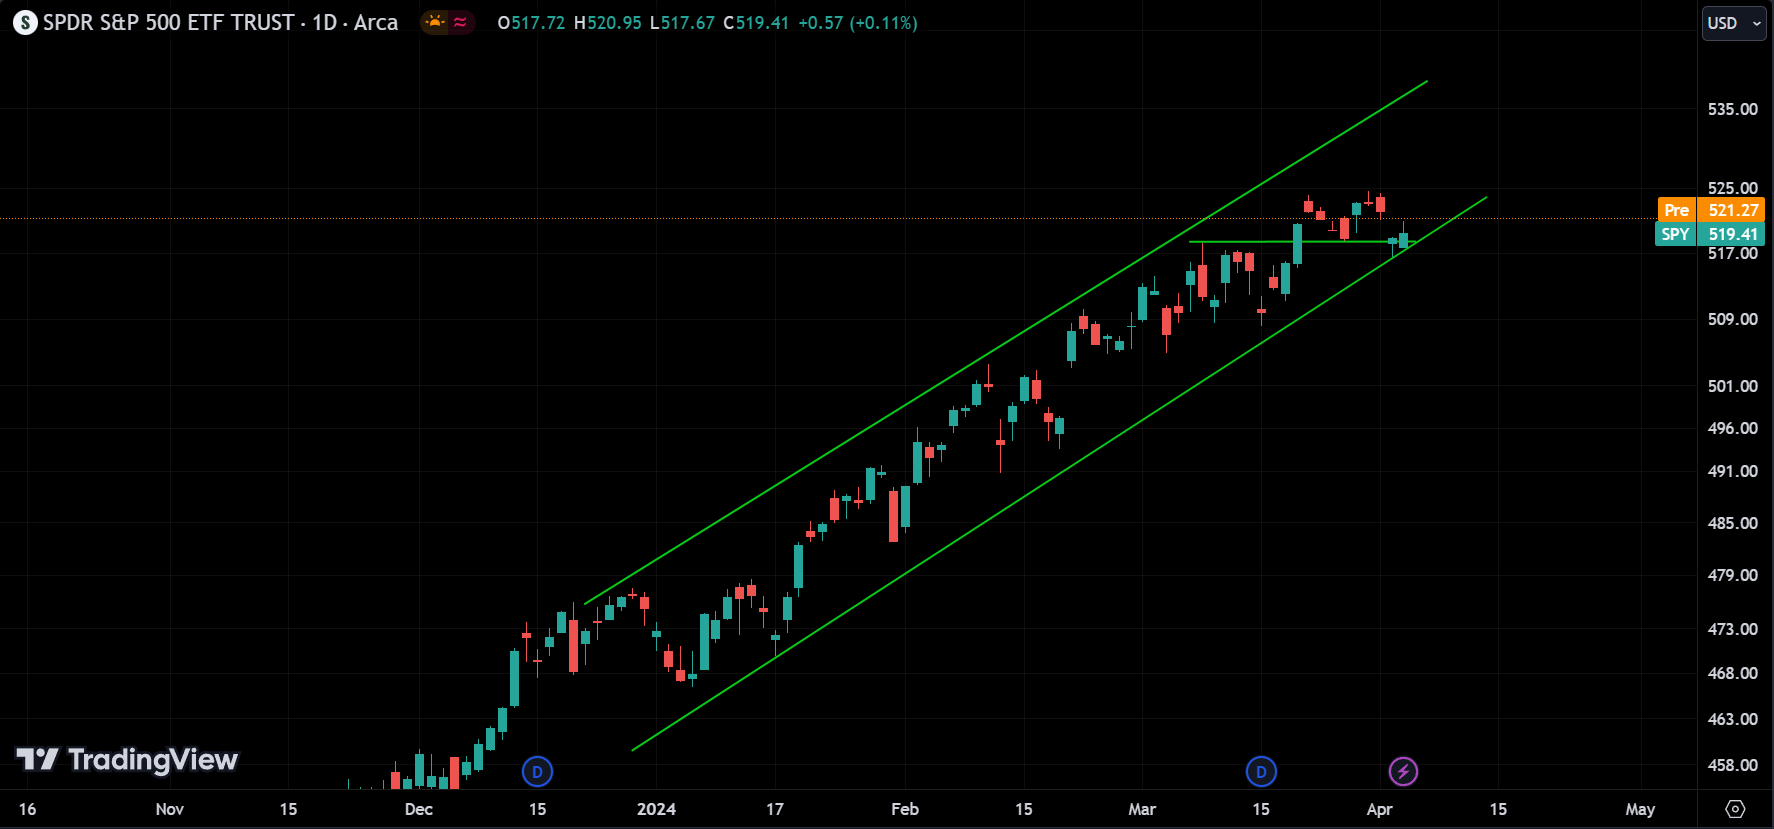
Regarding the SPY, as anticipated, it bounced back up from the lower trend line, indicating that the channel or trend remains intact. We can expect it to either continue rising or possibly experience further correction. However, the overall trend for stocks is bullish at the moment.
You have to keep an eye on the channel. If it breaks upward, then it’s all good because the trend will still be bullish. However, if it breaks downward, that’s the beginning of a downtrend. So, you’ve got to be prepared for it.
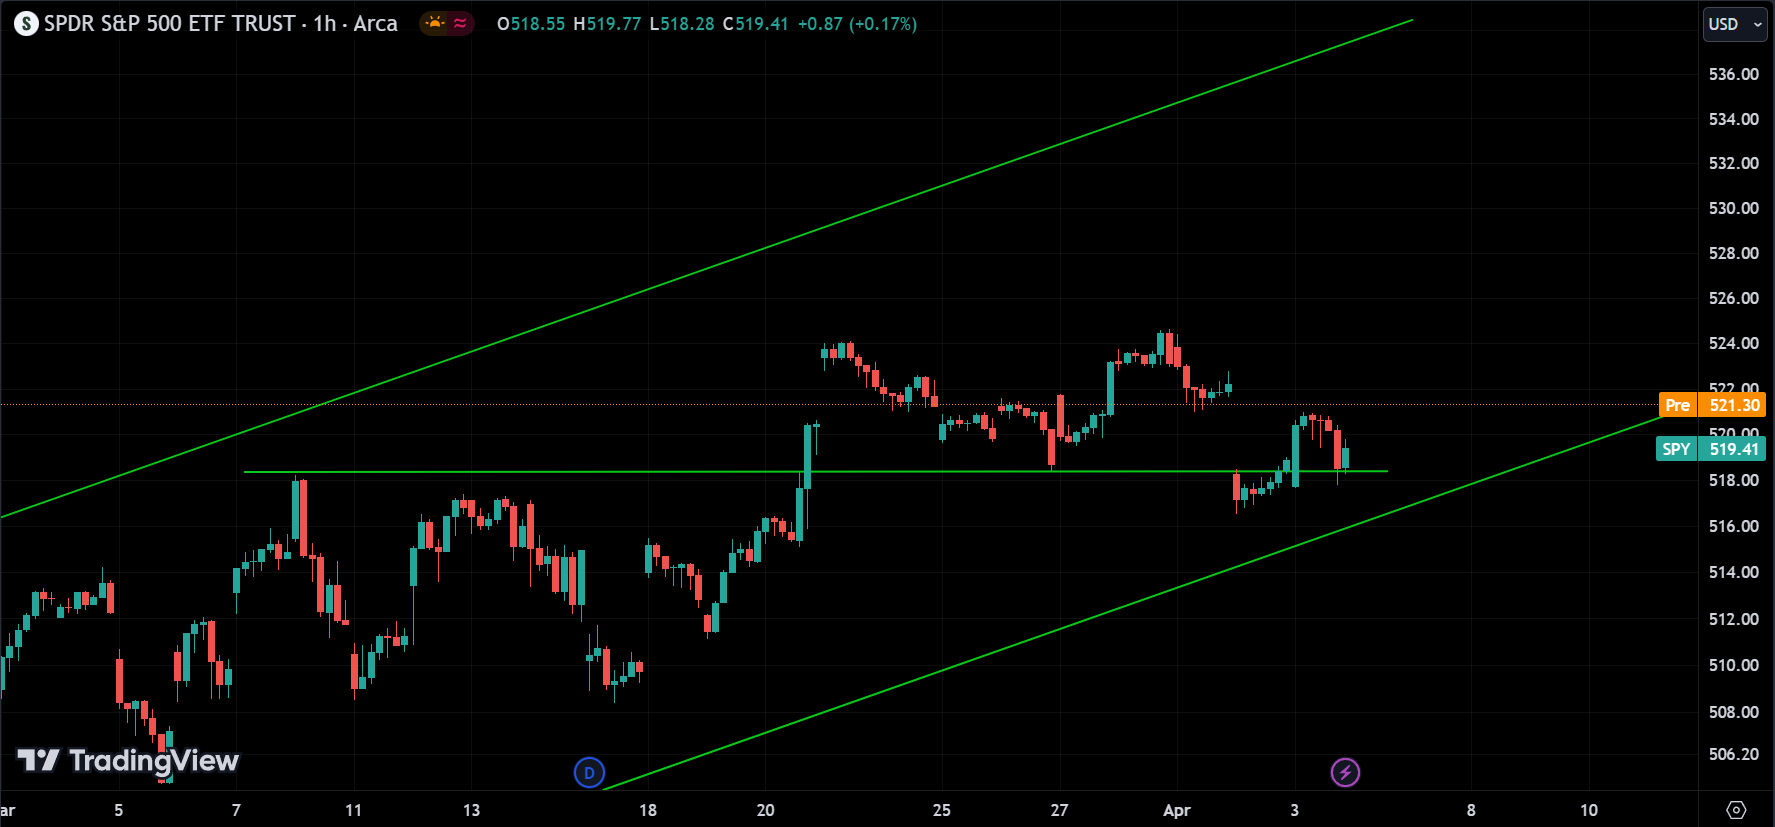
if we take a closer look at what happened yesterday, the price sharply surged, largely influenced by Powell’s speech, before swiftly retracting to its original trading level and closing just above the opening price. Ultimately, it ended as a green day.
It appears that the price filled the gap. So, now, what we can anticipate for the market today is either a continuation of the upward movement or further correction, although it shouldn’t drop below the lower trend line. If it does breach this level, as we mentioned earlier, it could signify the beginning of a new downward trend. However, while it seems unlikely, we must remain cautious as anything can happen in the market. Keep this in mind.

Yesterday appeared to be predominantly positive for the market, with many stocks recording gains. However, notable players such as Microsoft and Nvidia experienced some losses.
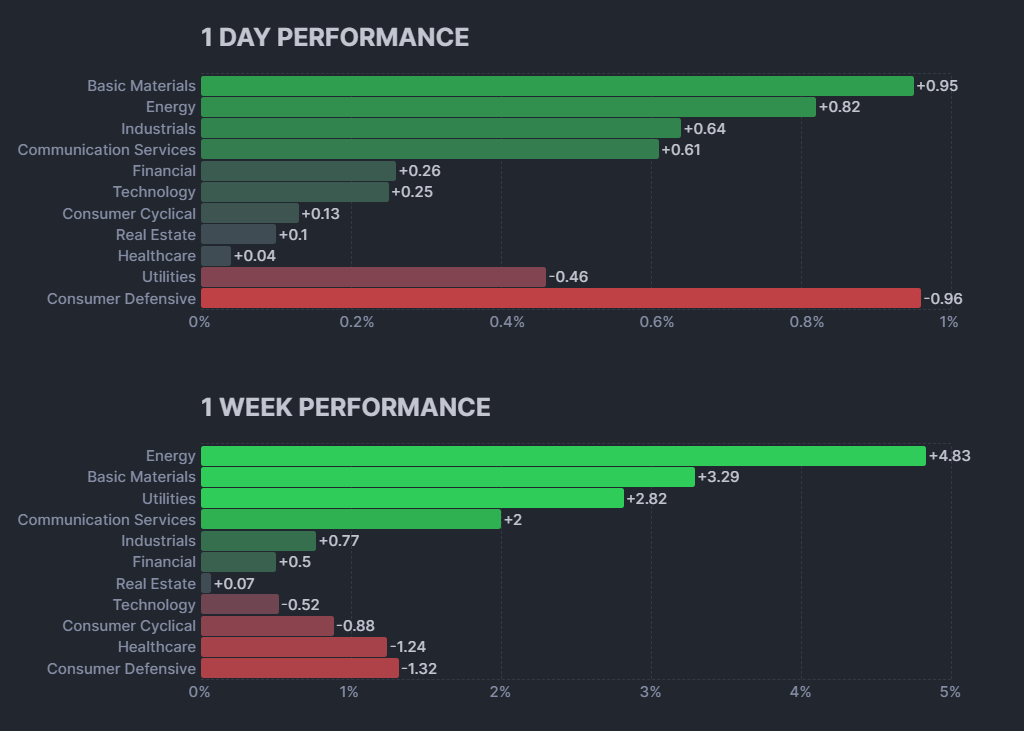
The overall market performance is positive for the week with most sectors in the green. The energy sector has performed the best, up +4.83%. However, the consumer defensive sector has declined the most, down -1.32%.
Looking at the one day performance, all sectors are positive except for consumer defensive which is down -0.96% and utilities which is down -0.46%. Basic materials has performed the best for the day, up +0.95%.
Overall, the stock market appears to be on an upward trend, although some sectors are performing better than others. The energy sector is the strongest performer, while the consumer defensive and utilities sectors are lagging behind.
Crypto
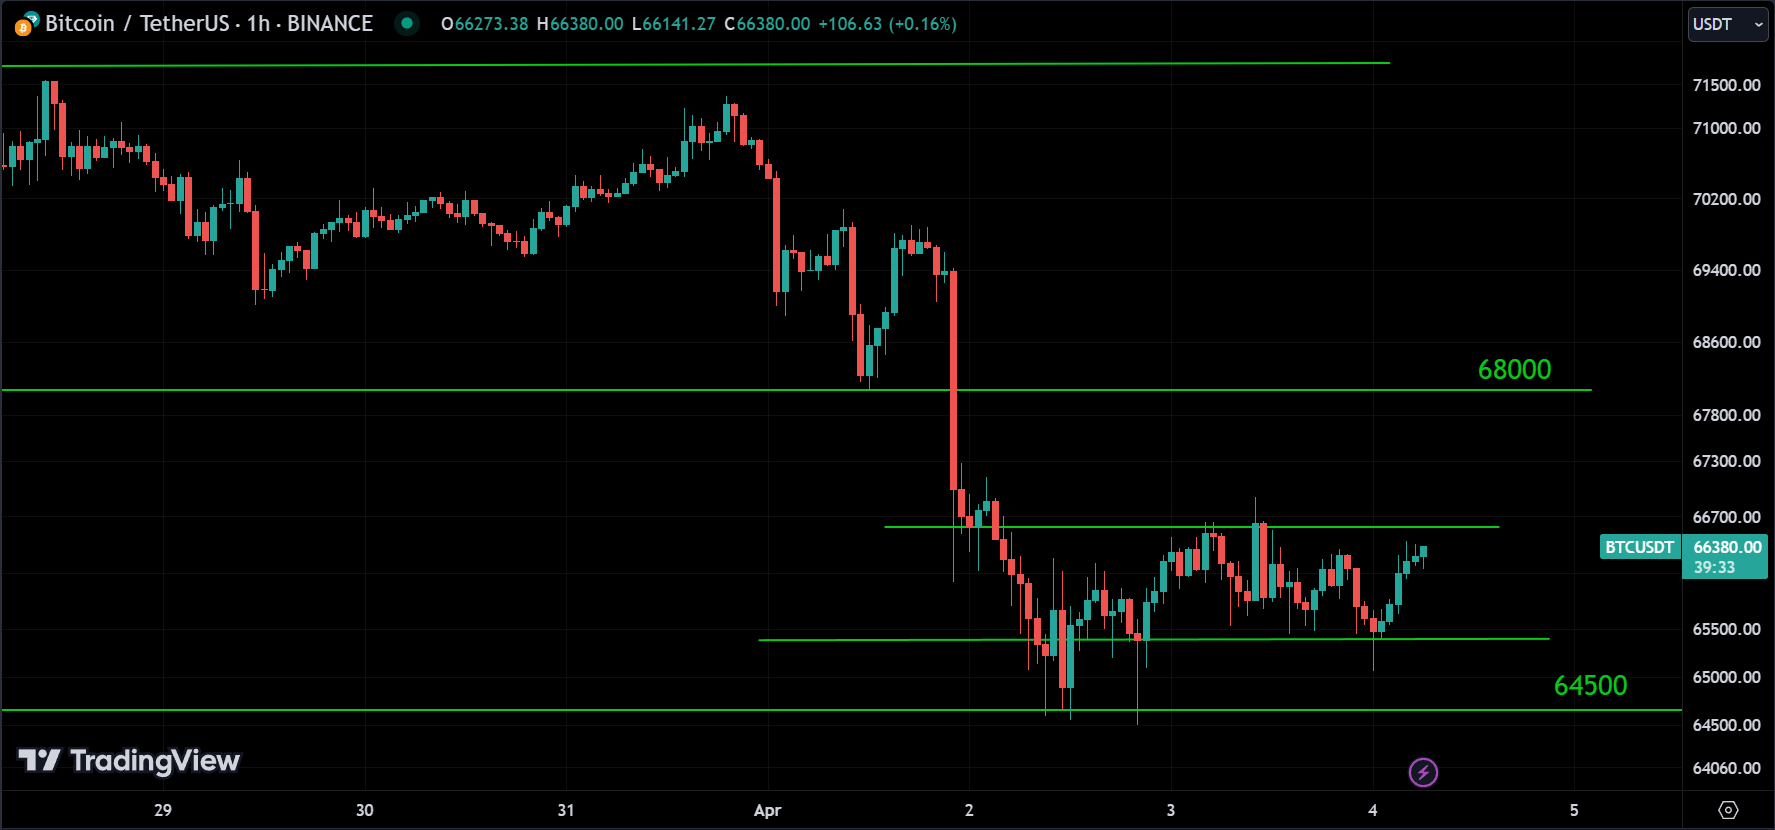
Regarding Bitcoin, it appears that the price is currently in a short-term sideways trend, showing signs of preparing for a breakout. The long wicks from the doji candles suggest significant indecision in the market, with strong support from buyers. So, what we can anticipate is that if the price breaks out of the short-term sideways channel, as it seems likely to do, then we may see an upward movement in price. Conversely, if it breaks downward, the correction phase may persist, potentially leading to a decline in price to around 64500 or even lower.
Given the support from buyers and historical patterns, we can indeed anticipate the price of Bitcoin to rise. As we’ve observed in the past, whenever BTC breaks out from a long-term dip and establishes a new high, it tends to continue its upward trajectory. This appears to be the current scenario, suggesting that the long-term trend for Bitcoin is indeed an uptrend.
Disclaimer
The information provided in this market analysis is for educational and informational purposes only. It should not be construed as financial advice or a recommendation to buy, sell, or hold any securities or investments.
All investments involve risk, and past performance is not indicative of future results. The analysis provided may not be suitable for all investors and should be used at their own discretion.
Readers are encouraged to conduct their own research.
Trading and investing in financial markets carries inherent risks, including the risk of losing invested capital. It is important to carefully consider your investment objectives, risk tolerance, and financial situation before making any investment decisions.