
![Forex Price Action Forecast [2024.07.26]: Key Levels and Market Trends Analysis for EURUSD, USDJPY, GBPUSD, AUDUSD, NZDUSD, USDCAD, and USDCHF
xlearnonline.com](https://xlearnonline.com/wp-content/uploads/2024/07/Forex-Analysis-1-4.jpg)
Hi, welcome to xlearn’s daily forex market analysis for day traders. This analysis focuses on price action trading.
Before we jump into the actual analysis, let’s take a look at the major economic events that could affect the market.
Key Economic Events Today
These events encompass important global news, macroeconomic reports, and economic indicators. For more details, you can check the forex factory.
- 8:30 ET: The US will release its PCE Price Index for the month. This index measures the change in prices for goods and services bought by consumers, excluding food and energy. The previous value was 0.1%, and the forecast is 0.2%. If the actual value is higher than the forecast, it is positive for the currency. This index is the Federal Reserve’s main measure of inflation. Inflation affects currency value because higher prices can lead the central bank to raise interest rates to control inflation.
Forex Price Action Analysis
EURUSD:
![EURUSD Price Action Technical Analysis [2024.07.26]
xlearnonline.com](https://xlearnonline.com/wp-content/uploads/2024/07/EURUSD-D-12.png)
![EURUSD Price Action Technical Analysis [2024.07.26]
xlearnonline.com](https://xlearnonline.com/wp-content/uploads/2024/07/EURUSD-H-11.png)
EURUSD was in an uptrend but has pulled back from the resistance level of 1.09500. It found support around 1.08300 and is now consolidating. If the price breaks below this support level, we can expect it to drop further. However, the price might also rise to the resistance at 1.09000 and then pull back again. If it breaks above this resistance, it can continue to move up.
USDCAD:
![USDCAD Price Action Technical Analysis [2024.07.26]
xlearnonline.com](https://xlearnonline.com/wp-content/uploads/2024/07/USDCAD-D-11.png)
![USDCAD Price Action Technical Analysis [2024.07.26]
xlearnonline.com](https://xlearnonline.com/wp-content/uploads/2024/07/USDCAD-H-11.png)
USDCAD has been consolidating. Right now, it is pulling back from the resistance level at 1.38500. We can expect it to drop to the support level around 1.36600. If it breaks below this level, it may go down to 1.36000 before pulling back. On the other hand, if the price breaks above the resistance at 1.38500, we can expect it to keep going up.
USDJPY:
![USDJPY Price Action Technical Analysis [2024.07.26]
xlearnonline.com](https://xlearnonline.com/wp-content/uploads/2024/07/USDJPY-D-12.png)
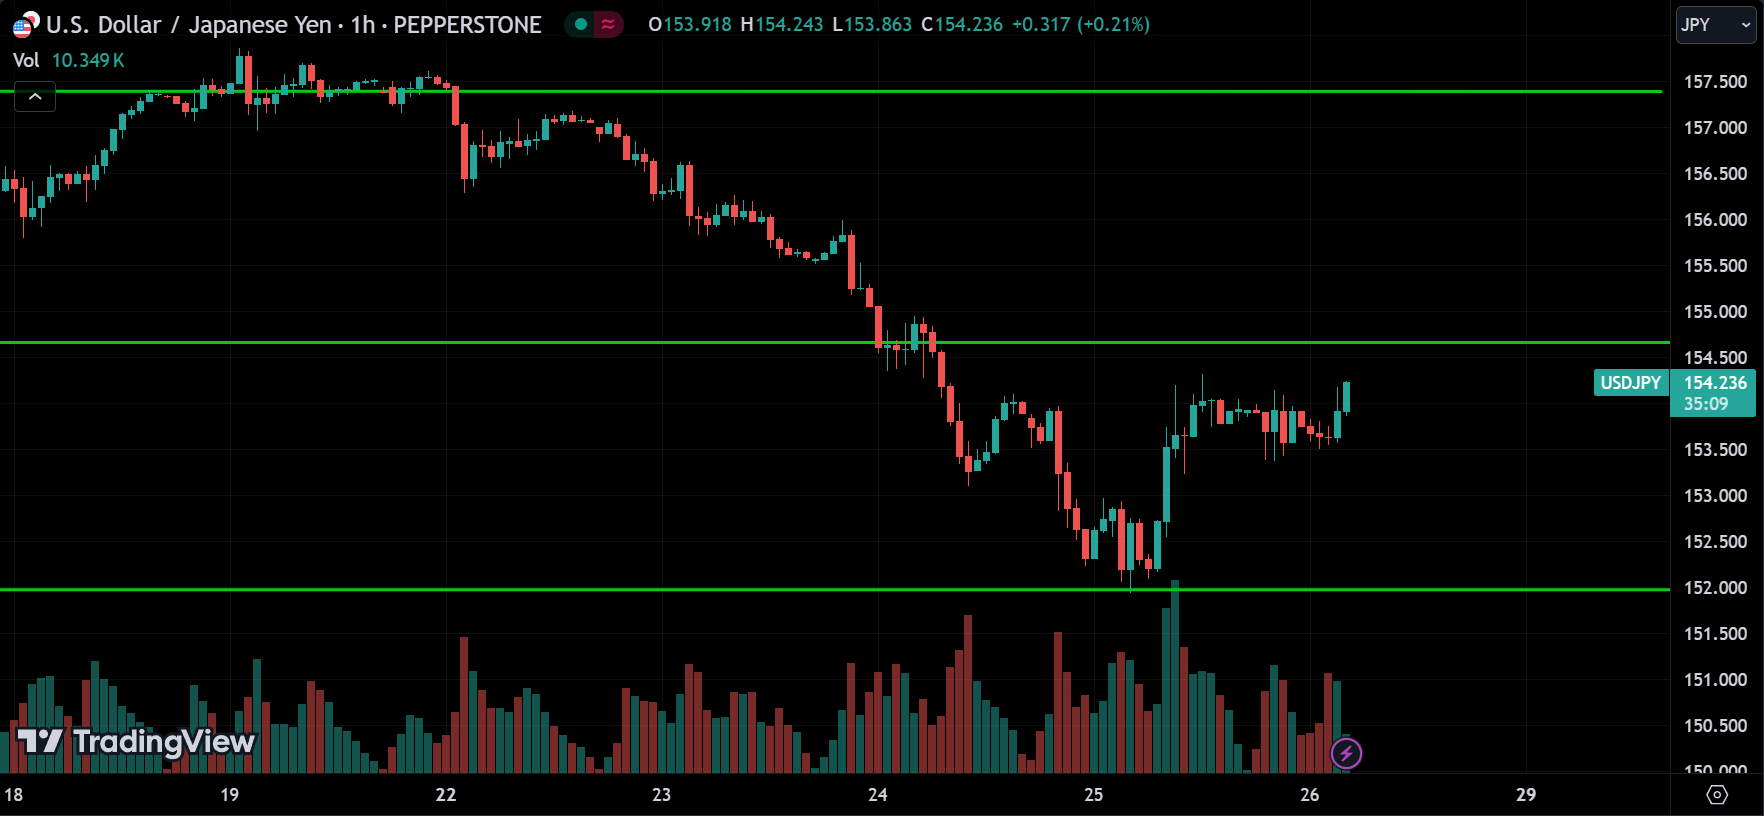
USDJPY is trending down, but it’s currently pulling back from the support level at 152.000. If the price breaks above the resistance at 154.500, we can expect it to continue rising to the next resistance level at 157.500. However, the price might also pull back from 154.500 and start dropping again, potentially breaking below the support level.
USDCHF:
![USDCHF Price Action Technical Analysis [2024.07.26]
xlearnonline.com](https://xlearnonline.com/wp-content/uploads/2024/07/USDCHF-D-12.png)
![USDCHF Price Action Technical Analysis [2024.07.26]
xlearnonline.com](https://xlearnonline.com/wp-content/uploads/2024/07/USDCHF-H-12.png)
USDCHF is trending down, but it’s currently pulling back from the support level at 0.87800 and has broken above the resistance at 0.88200. We can expect the price to continue rising to 0.88600. If it breaks this resistance, it might go up to 0.89200. However, since the overall trend is bearish, the price could start dropping from one of these resistance levels. Watch for reversal and breakout signals around these levels.
GBPUSD:
![GBPUSD Price Action Technical Analysis [2024.07.26]
xlearnonline.com](https://xlearnonline.com/wp-content/uploads/2024/07/GBPUSD-D-12.png)
![GBPUSD Price Action Technical Analysis [2024.07.26]
xlearnonline.com](https://xlearnonline.com/wp-content/uploads/2024/07/GBPUSD-H-12.png)
Looking at GBPUSD, it’s trending up but currently pulling back from the resistance at 1.30000. Right now, it’s around the support level at 1.28400. If the price breaks below this support, we can expect it to drop further to 1.28000, and if that level breaks, it can drop even more. On the other hand, the price might also pull back from one of these support levels. So, watch for both reversal and breakout signals.
AUDUSD:
![AUDUSD Price Action Technical Analysis [2024.07.26]
xlearnonline.com](https://xlearnonline.com/wp-content/uploads/2024/07/AUDUSD-D-12.png)
![AUDUSD Price Action Technical Analysis [2024.07.26]
xlearnonline.com](https://xlearnonline.com/wp-content/uploads/2024/07/AUDUSD-H-12.png)
AUDUSD is trending down and is currently between the support level at 0.64750 and the resistance level at 0.65500. If the price breaks below the support, we can expect it to continue dropping. On the other hand, if the price breaks above the resistance, we can expect it to continue going up. Wait for the breakout to confirm the trend.
NZDUSD:
![NZDUSD Price Action Technical Analysis [2024.07.26]
xlearnonline.com](https://xlearnonline.com/wp-content/uploads/2024/07/NZDUSD-D-12.png)
![NZDUSD Price Action Technical Analysis [2024.07.26]
xlearnonline.com](https://xlearnonline.com/wp-content/uploads/2024/07/NZDUSD-H-12.png)
NZDUSD is trending down and is currently at the major support level of 0.58500. If the price breaks below this support, we can expect it to continue dropping further. However, the price could also start going up from this support level.
Conclusion & Disclaimer
Please provide your feedback on how we can improve this article. Thank you!
These analyses are here to help you understand how to analyze the market. They’re not about giving buy or sell signals. It’s simply about observing price action market behavior. I don’t recommend when to buy or sell because trading doesn’t work that way. You need a strategy to guide your decisions about when to enter or exit positions. That’s the key to making consistent profits in the financial markets over time.
The information provided in this market analysis is for educational and informational purposes only. It should not be construed as financial advice or a recommendation to buy, sell, or hold any securities or investments.
All investments involve risk, and past performance is not indicative of future results. The analysis provided may not be suitable for all investors and should be used at their own discretion.
Readers are encouraged to conduct their own research.
Trading and investing in financial markets carry inherent risks, including the risk of losing invested capital. It is important to carefully consider your investment objectives, risk tolerance, and financial situation before making any investment decisions.
GOOD LUCK✌!!!