![Stock Market Analysis Today [2024.07.05]: Key Trends, NVDA, TSLA, and AMZN Stocks to Watch
xlearnonline.com](https://xlearnonline.com/wp-content/uploads/2024/07/Stock-Market-Analysis-3.png)
Hello there, Welcome to Stock Market Analysis Today!
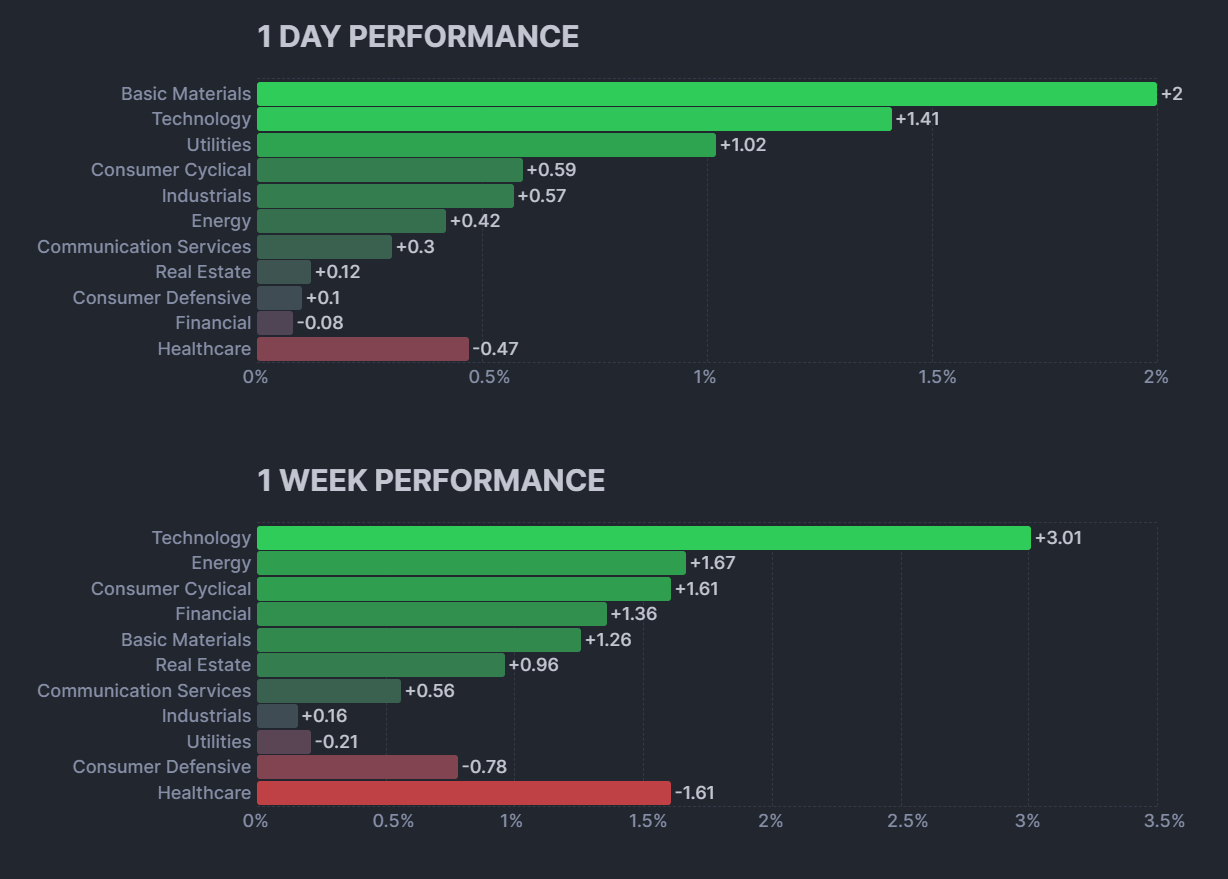
- S&P 500: In an uptrend and at its all-time high levels.
- Consumer Staples (XLP): In an uptrend with a consolidation phase within that trend.
- Energy (XLE): Broke resistance after trending down within a channel.
- Materials (XLB): Consolidating, with a recent break of support.
- Industrials (XLI): Consolidating, price is around the support level.
- Consumer Discretionary (XLY): Broke above resistance, uptrending.
- Healthcare (XLV): Consolidating, pulling back from resistance.
- Financials (XLF): At a decision zone, price pulled back from the major trend line.
- Technology (XLK): Leading the market, in an uptrend, at all-time high levels.
- Communications (XLC): Similar to technology, at all-time high levels.
- Utilities (XLU): Trending down.
- Real Estate (XLRE): Consolidating.
Stock Market Events Today
These events include important news that could impact the stock market, macroeconomic reports, and economic indicators. For more details, you can check the bloomberg calendar & yahoo finance.
- 8:30 AM ET: The unemployment report is coming out, which can give insights about the economy and may impact the market.
- 11:00 AM ET: The FED Monetary Policy Report is being released. This report provides a summary of discussions on monetary policy, economic developments, and future prospects. It is submitted, along with testimony from the Federal Reserve Chair, to the Senate Committee on Banking, Housing, and Urban Affairs, and the House Committee on Financial Services.
Stocks with Earnings:
No companies are reporting earnings today!
S&P 500
![SPY Analysis Today [2024.07.05]
xlearnonline.com](https://xlearnonline.com/wp-content/uploads/2024/07/SPY-D-2.png)
Looking at the S&P 500, it is in an uptrend and at its all-time high levels.
![SPY Analysis Today [2024.07.05]
xlearnonline.com](https://xlearnonline.com/wp-content/uploads/2024/07/SPY-H-2.png)
Looking at the 1-hour chart, it broke above the resistance level. We can expect the momentum to continue, but the price might also pull back to this level before going up again.
![S&P 500 Heatmap Analysis Today [2024.07.05]
xlearnonline.com](https://xlearnonline.com/wp-content/uploads/2024/07/heatmap-2.jpg)
Looking at the heatmap, NVDA gained 4.57%, AVGO gained 4.33%, and TSLA gained 6.54%. Overall, most sectors increased in value except for healthcare. Let’s look at the actual sector performance before diving deeper into each one.
Consumer Staples Sector(XLP):
![XLP Analysis Today [2024.07.05]
xlearnonline.com](https://xlearnonline.com/wp-content/uploads/2024/07/XLP-D-2.png)
Looking at the Consumer Staples sector, it is in an uptrend, but there is a consolidation phase within that uptrend.
![XLP Analysis Today [2024.07.05]
xlearnonline.com](https://xlearnonline.com/wp-content/uploads/2024/07/XLP-H-2.png)
In the 1-hour chart price action, you can clearly see the consolidation phase. The price is pulling back from the support level, and we can expect this upward momentum to continue. However, if the price breaks below the support, XLP may enter a downtrend.
Energy Sector(XLE):
![XLE Analysis Today [2024.07.05]
xlearnonline.com](https://xlearnonline.com/wp-content/uploads/2024/07/XLE-D-2.png)
Looking at the energy sector, the price was trending down within a channel, but it seems like the price has broken above the resistance.
![XLE Analysis Today [2024.07.05]
xlearnonline.com](https://xlearnonline.com/wp-content/uploads/2024/07/XLE-H-2.png)
Looking at the 1-hour chart, you can see that the price is above the resistance level and has even pulled back to that level. Now, it is consolidating around that level. We can expect the price to start going up, but if it breaks below this level and gets back inside the channel, the trend is still undecided.
Materials Sector(XLB):
![XLB Analysis Today [2024.07.05]
xlearnonline.com](https://xlearnonline.com/wp-content/uploads/2024/07/XLB-D-2.png)
Looking at the materials sector, it was consolidating, but now it seems like the price has broken the support.
![XLB Analysis Today [2024.07.05]
xlearnonline.com](https://xlearnonline.com/wp-content/uploads/2024/07/XLB-H-2.png)
Looking at the 1-hour chart, you can see that the price went down from the support and pulled back to that level, and is now trading around there. We can expect the price to start dropping from this level if the breakout is true. However, if the price goes back up to the consolidation phase zone, then the trend is still undecided.
Industrial Sector(XLI):
![XLI Analysis Today [2024.07.05]
xlearnonline.com](https://xlearnonline.com/wp-content/uploads/2024/07/XLI-D-2.png)
Looking at the Industrials sector, it is consolidating and the price is around the support level.
![XLI Analysis Today [2024.07.05]
xlearnonline.com](https://xlearnonline.com/wp-content/uploads/2024/07/XLI-H-2.png)
Looking at the 1-hour chart, you can see the price is pulling back from the support. We can expect the price to go up to the resistance shown on the chart before pulling back. There is also a chance the price could break above the resistance and continue rising. However, the price could also drop and break below the support, so watch for any potential breakouts.
Consumer Discretionary Sector(XLY):
![XLY Analysis Today [2024.07.05]
xlearnonline.com](https://xlearnonline.com/wp-content/uploads/2024/07/XLY-D-2.png)
Looking at the Consumer Discretionary sector, the price was consolidating, and it has now broken above the resistance level.
![XLY Analysis Today [2024.07.05]
xlearnonline.com](https://xlearnonline.com/wp-content/uploads/2024/07/XLY-H-2.png)
Looking at the 1-hour chart, you can clearly see the price uptrending. Since it broke the major resistance level, we can expect the overall trend to be bullish. The price might pull back to this level before continuing up, or it could continue rising without pulling back.
Healthcare Sector(XLV):
![XLV Analysis Today [2024.07.05]
xlearnonline.com](https://xlearnonline.com/wp-content/uploads/2024/07/XLV-D-2.png)
Looking at the healthcare sector, the price is consolidating and is currently pulling back from the resistance level.
![XLV Analysis Today [2024.07.05]
xlearnonline.com](https://xlearnonline.com/wp-content/uploads/2024/07/XLV-H-2.png)
From the 1-hour chart price action, you can see the price is at a support level. We can expect a pullback from this level, or it could break below this level and continue to the next support.
Financials Sector(XLF):
![XLF Analysis Today [2024.07.05]
xlearnonline.com](https://xlearnonline.com/wp-content/uploads/2024/07/XLF-D-2.png)
Looking at the financial sector, it’s at a major decision zone. The price should start a downtrend since it broke the support, but we can’t confirm that yet.
![XLF Analysis Today [2024.07.05]
xlearnonline.com](https://xlearnonline.com/wp-content/uploads/2024/07/XLF-H-2.png)
As you can see, the price is pulling back from the major trend line. If the price goes above this trend line, we can say the upward momentum is still there and the price may start to go up. If the price starts to drop from this level, we can assume that a new downward trend has begun.
Technology Sector(XLK):
![XLK Analysis Today [2024.07.05]
xlearnonline.com](https://xlearnonline.com/wp-content/uploads/2024/07/XLK-D-2.png)
Looking at the technology sector, it is leading the market, in an uptrend, and at all-time high levels.
![XLK Analysis Today [2024.07.05]
xlearnonline.com](https://xlearnonline.com/wp-content/uploads/2024/07/XLK-H-2.png)
Looking at the 1-hour chart price action, the price is at the resistance level. If the price breaks above this level, we can expect it to continue going up and make new highs. However, there is also a chance of the price pulling back from this level, so watch out for both reversal and breakout signals.
Communications Sector(XLC):
![XLC Analysis Today [2024.07.05]
xlearnonline.com](https://xlearnonline.com/wp-content/uploads/2024/07/XLC-D-2.png)
Looking at the communication sector, it is similar to the technology sector, with the price at all-time high levels.
![XLC Analysis Today [2024.07.05]
xlearnonline.com](https://xlearnonline.com/wp-content/uploads/2024/07/XLC-H-2.png)
Looking at the 1-hour chart, you can see the price is pulling back up from support and is slowly heading to the resistance. Pre-market data shows the price is now at the resistance. If the price goes above this resistance, we can expect the momentum to continue, but there is also a chance for pullbacks.
Utility Sector(XLU):
![XLU Analysis Today [2024.07.05]
xlearnonline.com](https://xlearnonline.com/wp-content/uploads/2024/07/XLU-D-2.png)
Looking at the utilities sector, it’s trending down.
![XLU Analysis Today [2024.07.05]
xlearnonline.com](https://xlearnonline.com/wp-content/uploads/2024/07/XLU-H-2.png)
From the 1-hour chart, you can clearly see the downward trend. We can expect this momentum to continue, but the price could also pull back, so watch out.
Real Estate Sector(XLRE):
![XLRE Analysis Today [2024.07.05]
xlearnonline.com](https://xlearnonline.com/wp-content/uploads/2024/07/XLRE-D-3.png)
Looking at the real estate sector, it’s consolidating.
![XLRE Analysis Today [2024.07.05]
xlearnonline.com](https://xlearnonline.com/wp-content/uploads/2024/07/XLRE-H-3.png)
Looking at the 1-hour chart, you can see the price is pulling back from the support level and appears to be in a medium-term upward momentum. We can expect this momentum to continue to the resistance level before pulling back.
Stocks to Watch Today
NVDA:
![NVDA Analysis Today [2024.07.05]
xlearnonline.com](https://xlearnonline.com/wp-content/uploads/2024/07/NVDA-H.png)
Looking at Nvidia, after strong momentum, the price pulled back and went into a consolidation phase. Now, the price is starting to show some upward momentum but is still at a resistance level. If the price breaks above this level, we can expect the momentum to continue upward. However, the price could also pull back from that level, so wait for confirmation before taking any positions.
TSLA:
![TSLA Analysis Today [2024.07.05]
xlearnonline.com](https://xlearnonline.com/wp-content/uploads/2024/07/TSLA-1.png)
Looking at Tesla, after downtrending for the last couple of months, the price has started to show strong upward momentum. We can assume that the downward trend is over, and now the price is going bullish. Tesla is trending again.
AMZN:
![AMZN Analysis Today [2024.07.05]
xlearnonline.com](https://xlearnonline.com/wp-content/uploads/2024/07/AMZN.png)
Looking at Amazon, it’s at its all-time high levels. The past five earnings reports have been positive, and if the next earnings report is also positive, we can expect this momentum to continue. Additionally, Jeff Bezos is selling $5 billion worth of shares, which is a good sign. We can expect the stock to make new highs in the future.
Conclusion & Disclaimer
Please provide your feedback on how we can improve this article. Thank you!
We discussed these sectors and markets because when the entire market or sector goes through certain movements, most of the stocks within that market will also experience similar movements. So, by understanding what the market is doing, you can conduct your own analysis on specific stocks.
These analyses are here to help you understand how to analyze the market. They’re not about giving buy or sell signals. It’s simply about observing price action market behavior. I don’t recommend when to buy or sell because trading doesn’t work that way. You need a strategy to guide your decisions about when to enter or exit positions. That’s the key to making consistent profits in the financial markets over time.
The information provided in this market analysis is for educational and informational purposes only. It should not be construed as financial advice or a recommendation to buy, sell, or hold any securities or investments.
All investments involve risk, and past performance is not indicative of future results. The analysis provided may not be suitable for all investors and should be used at their own discretion.
Readers are encouraged to conduct their own research.
Trading and investing in financial markets carry inherent risks, including the risk of losing invested capital. It is important to carefully consider your investment objectives, risk tolerance, and financial situation before making any investment decisions.
GOOD LUCK✌!!!