Technical analysis is a study of price and volume.
We already looked at prices as candlesticks and chart patterns, now let’s look at what does volume mean in stocks or any other assets.
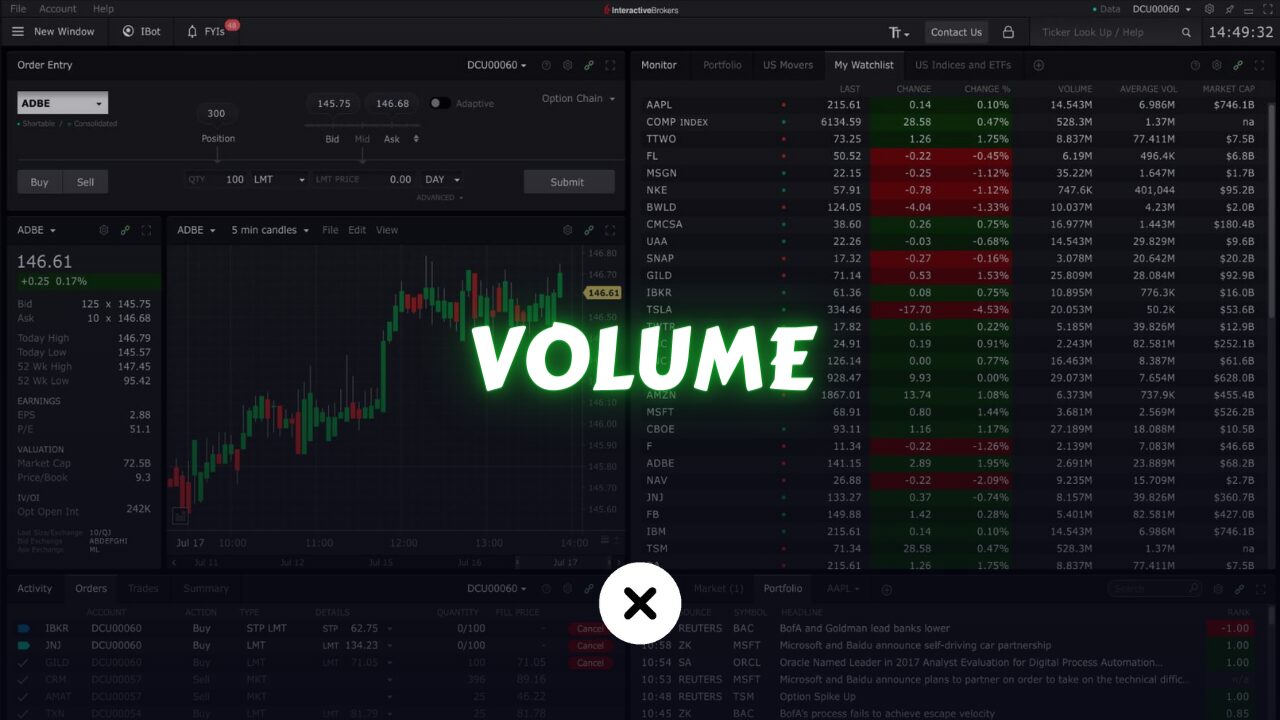
What is Volume?
Volume, in financial markets, refers to the total number of shares or units traded during a specific time period. It’s always shown at the bottom of the chart.
Remember order execution and fills? that generate a volume. for example, if 100 shares are sold in the market, that’s 100 shares of volume.
It represents the level of activity and liquidity in the market for a particular asset, such as stocks, commodities, or currencies.
Volume is typically measured on a per-unit basis, such as the number of shares traded on a stock exchange or the total contracts traded on a futures exchange.
It provides insights into the level of interest and participation of traders in buying and selling a particular asset. analyzing volume in conjunction with price movements can provide valuable information to traders.
For example, high trading volume during a price increase may indicate strong buying interest and potential bullish market sentiment.
Conversely, high volume during a price decline could suggest heightened selling pressure and a bearish market outlook.
Example:
Suppose houses in your neighborhood typically have a price range of around 500k. Now, if a single house was sold for 2M, it would not necessarily mean that all the houses in your neighborhood are valued at 2M. However, if a significant number of houses, let’s say 100, were sold at a valuation close to 2M, then it would be reasonable to conclude that the houses in that neighborhood are indeed worth around 2M.
So the quantity does matter. it’s the same thing with stock,
Imagine this: You have a stock that doesn’t trade much, and suddenly, someone wants to buy it. But the only offers are at very high prices. So, this person buys the stock, pushing its price higher. Would you think the stock’s value went up after just one trade? Probably not.
For a price to be meaningful, there needs to be enough trading activity at that price. So, volume confirms prices.
Now, “The volume proceeds price.” what does that mean?
The idea of “volume precedes price” suggests that when something big happens, possibly leading to a stock’s movement, there will be a notable rise in trading volume before any significant price change occurs.
But if the price moves a lot and with little to no volume, then there is a very low probability of continuation.
What is the Average Volume in Stocks?
Average volume refers to the typical or average amount of trading activity that occurs for a particular financial instrument, such as a stock, commodity, or currency pair, over a specified period.
It is a measure of the number of or units of the stocks that are bought and sold during a given timeframe, usually expressed as a daily figure.
To calculate the average volume, you would typically consider the total volume traded over a specific period, such as a day, week, month, or year, and divide it by the number of trading days in that period.
This calculation provides an average or representative value of the trading activity for that particular asset during the specified timeframe.
The most used timeframe by traders and investors is 3 Months.
The average volume is an important metric used by traders to assess the liquidity and market interest in a financial instrument. It helps determine the ease with which an asset can be bought or sold without significantly impacting its price.
Higher average volumes generally indicate greater market activity and liquidity, making it easier to enter or exit positions without significant price slippage.
Traders often compare the current trading volume of an asset to its average volume to identify unusual or significant trading activity.
Unusually high volume can indicate increased market interest or significant news or events that are impacting the asset’s price. Conversely, an unusually low volume may suggest a lack of market interest or a period of consolidation.
Average volume can vary widely across different financial instruments. Highly liquid assets such as large-cap stocks or major currency pairs tend to have higher average volumes compared to smaller, less actively traded stocks or exotic currency pairs.
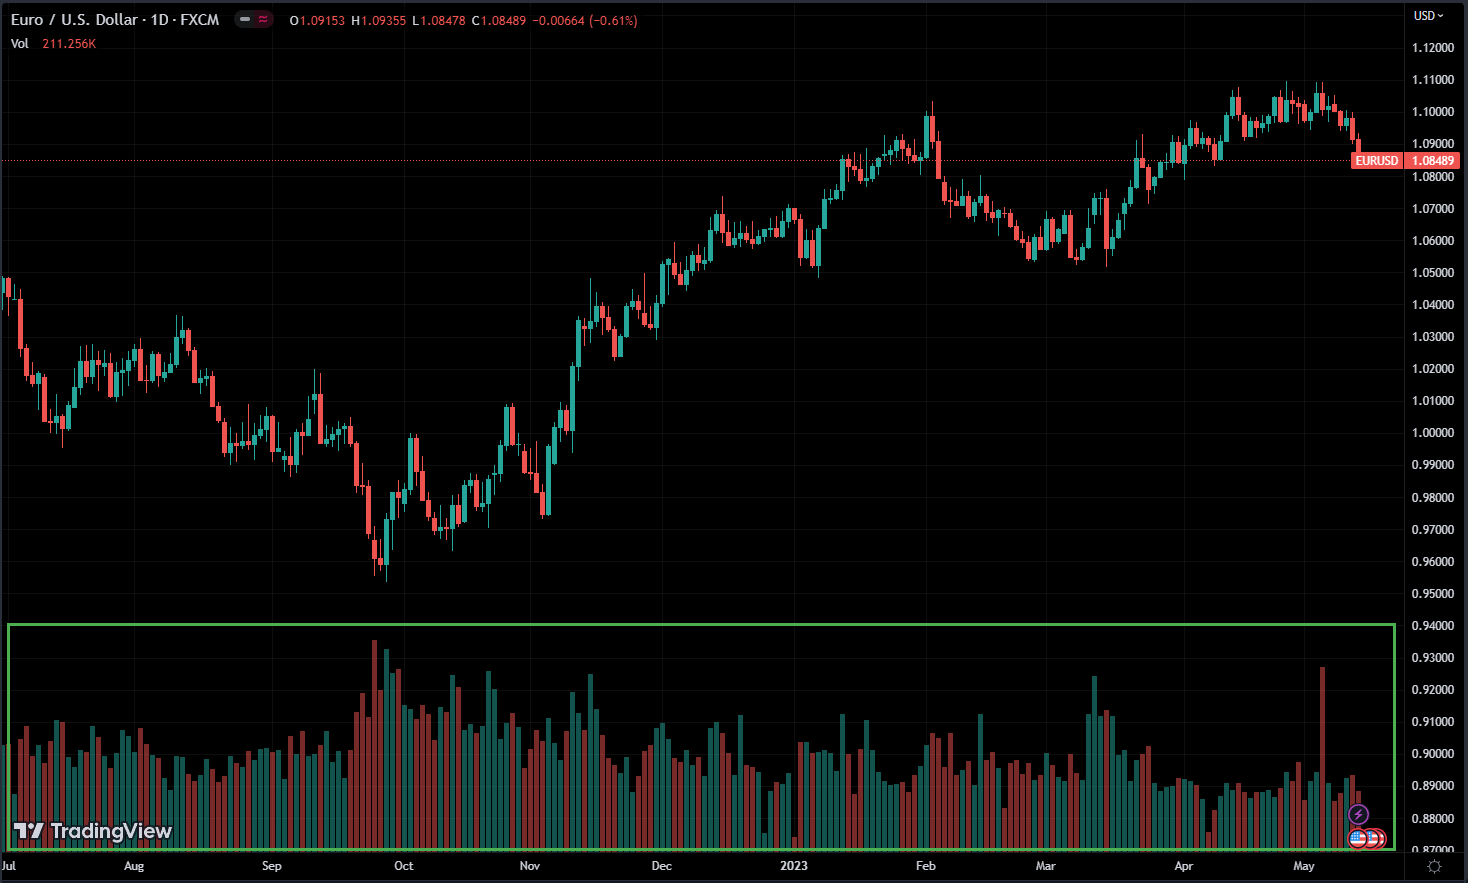
For forex, we mostly just look at the chart for the volume, but for stocks it’s different.
For example, check out Tesla’s stock
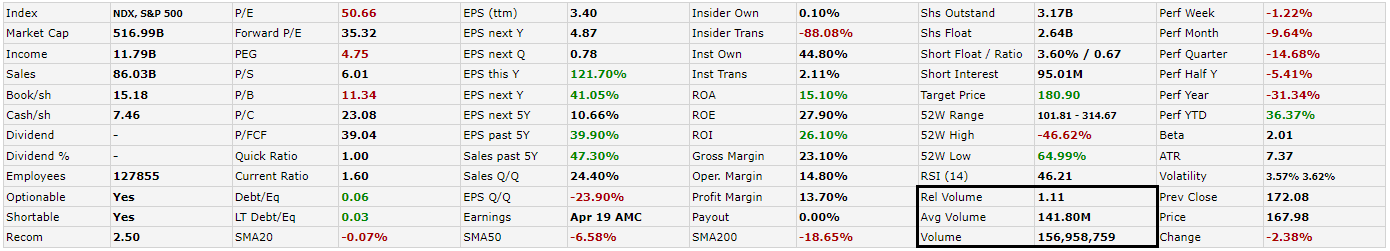
Volume shows the current volume for the day, and Avg volume shows the average volume it does in a day. and if a stock reaches its average volume on a normal day, you don’t want to get in an intraday position because the stock already moved, as it usually does, so we expect that there is no more room for movement for that day.
What is the Relative Volume of Stocks?
Relative volume is a measure used in financial markets to compare the current trading volume of an asset to its average volume over a specific period.
It provides a relative perspective on the level of trading activity occurring for a particular asset at a given time. It indicates whether the current volume is higher or lower than the average.
When the relative volume surpasses 1, it indicates that the asset is being traded more actively compared to its usual level. On the other hand, if the relative volume falls below 1, it suggests that the asset is being traded less frequently than its average level.
To calculate relative volume, divide the current trading volume by the average volume.
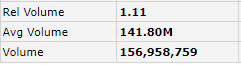
In this example, the relative volume is 1.11 meaning that the stock traded 11% more than it used to trade.
We can only compare a stock’s volume to itself, we do that by looking at relative volume.
It makes no sense to compare a stock’s volume to another stock’s volume because it’s fundamentally 2 different things.
Relative volume is useful for identifying periods of increased or decreased market interest in an asset. It helps traders assess the significance of the current trading volume in relation to the asset’s typical levels of activity.
Higher relative volume may indicate heightened market attention, such as during news events, earnings announcements, or other catalysts. Lower relative volume may suggest reduced market participation, such as during holidays or periods of low volatility.
In simple words, we traders look at the relative volume to understand if something going on with the stock, whether it is trading a lot or not.
Volume can help identify trends, spot unusual market behavior, or confirm the significance of price movements. if you want to go in a direction that already heading, you want to make sure that enough volume supports that direction.
Volume is needed for the price to keep moving in the same direction. so volume confirms direction, it’s super important.
Conclusion
Volume is a fundamental aspect of stock trading that provides valuable insights into market dynamics and investor sentiment. By understanding the significance of volume and its implications, traders and investors can make more informed decisions, whether identifying trends, confirming reversals, or assessing market liquidity.