
![Forex Market Analysis Today[2024.05.30]: US Preliminary GDP Report Day.
xlearnonline.com](https://xlearnonline.com/wp-content/uploads/2024/05/Green-and-Red-Trading-YouTube-Thumbnail.jpg)
Hello, it’s 30th May 2024, Thursday. One more day left in May. Let’s get into our forex market analysis today.
Key Trading Events Today
These events encompass important global news, macroeconomic reports, and economic indicators. For more details, you can check the Forex Factory Economic Calendar.
We have the Preliminary GDP report for the US coming out this morning, along with the Unemployment Claims report.
Other than these two, there is nothing much to worry about.
EURUSD:
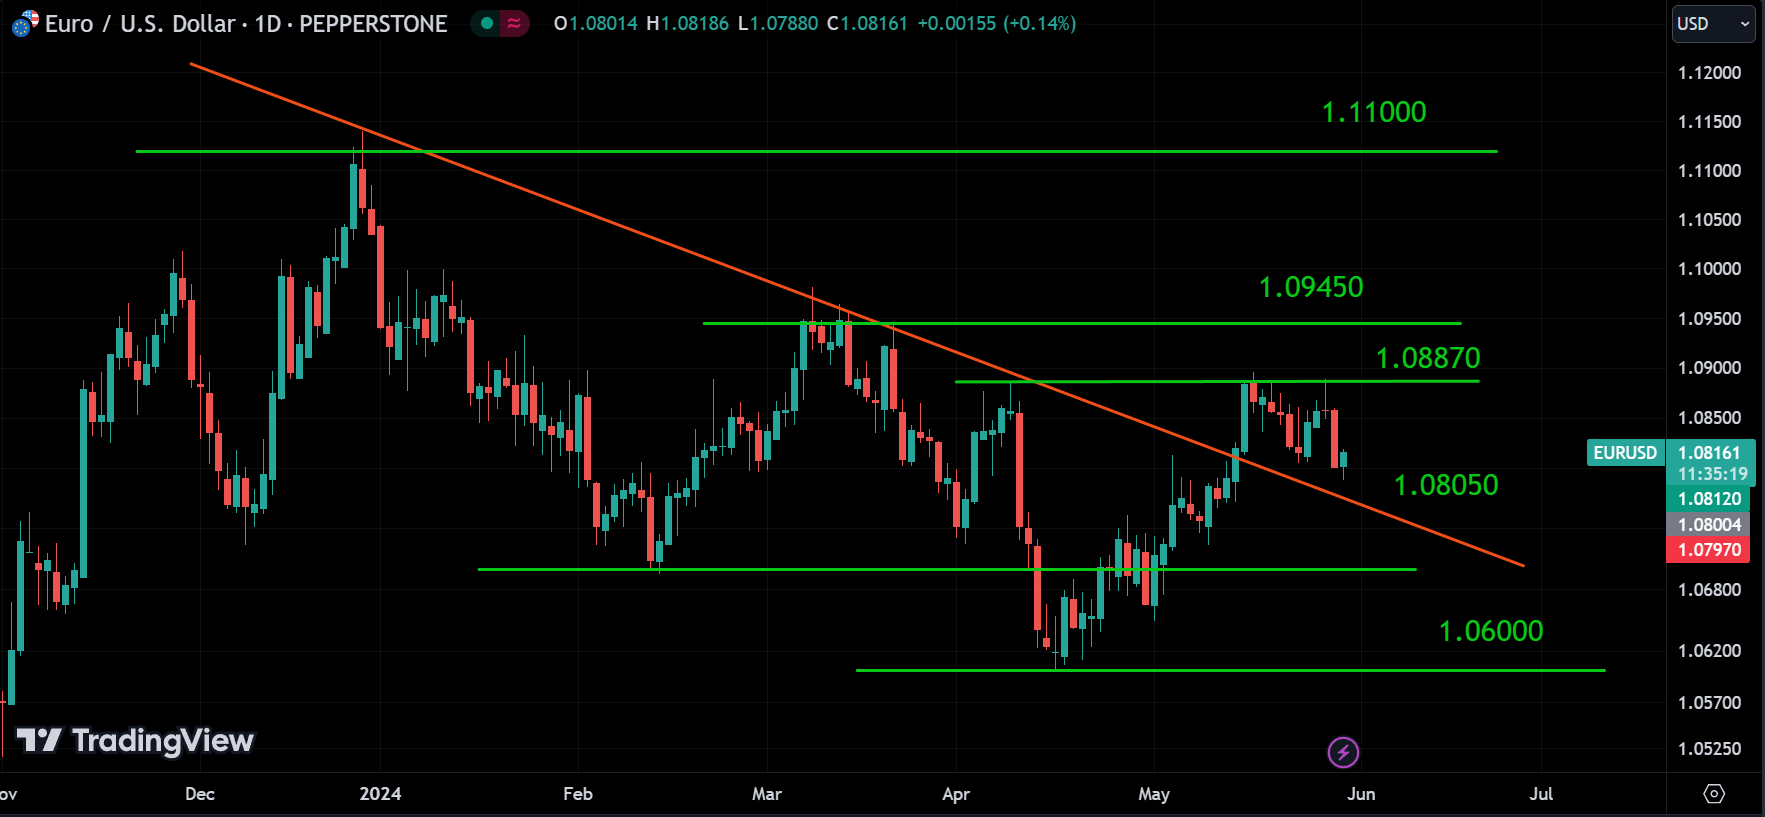
Looking at EUR/USD, it’s still in a correction phase. The price is above the red line, and as long as it stays above that line, we can say the overall trend is still in an uptrend.
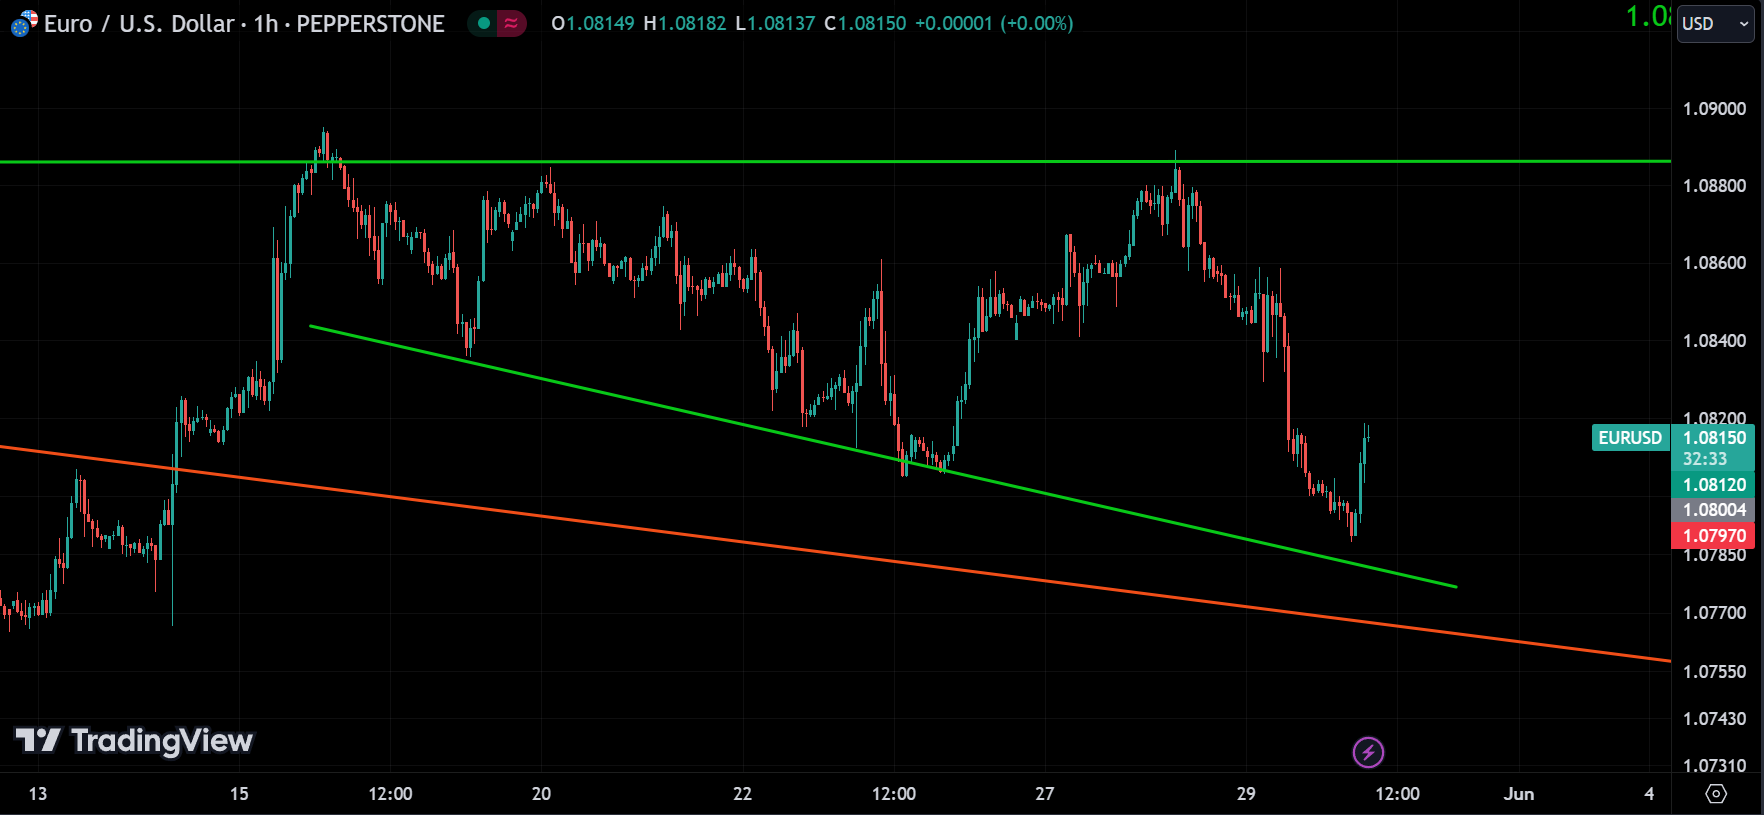
On the 1-hour chart, it looks like the correction is almost over. There are three green candles from the low, indicating it might be starting to go up. So overall, the trend should be bullish. However, keep an eye on the red line and the green trend line on the 1-hour chart, as they act as support. If the price breaks below these lines, the trend might change.
Also, remember that the GDP report is coming out this morning, which is a volatile event for the markets and might impact the trend. If I were you, I wouldn’t trade EUR/USD today.
USDCAD:
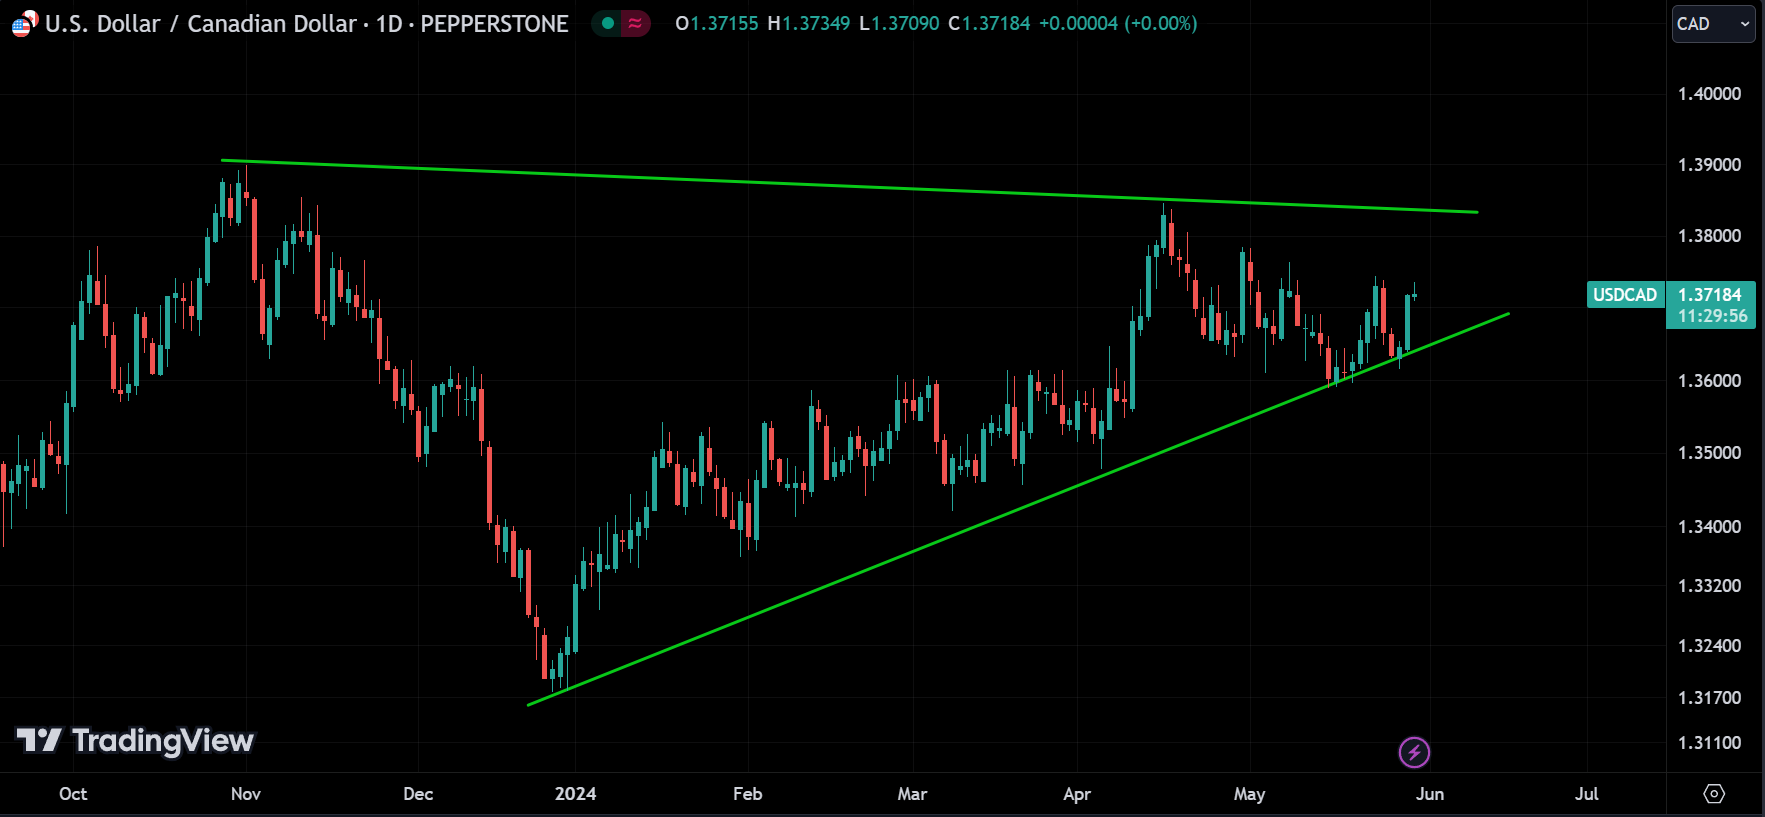
Looking at USD/CAD, it’s still in an uptrend. The price is moving inside a triangle shape, indicating pressure from both sellers and buyers, so it’s going to break in one direction eventually. Someone has to win, and that breakout will determine the overall trend.
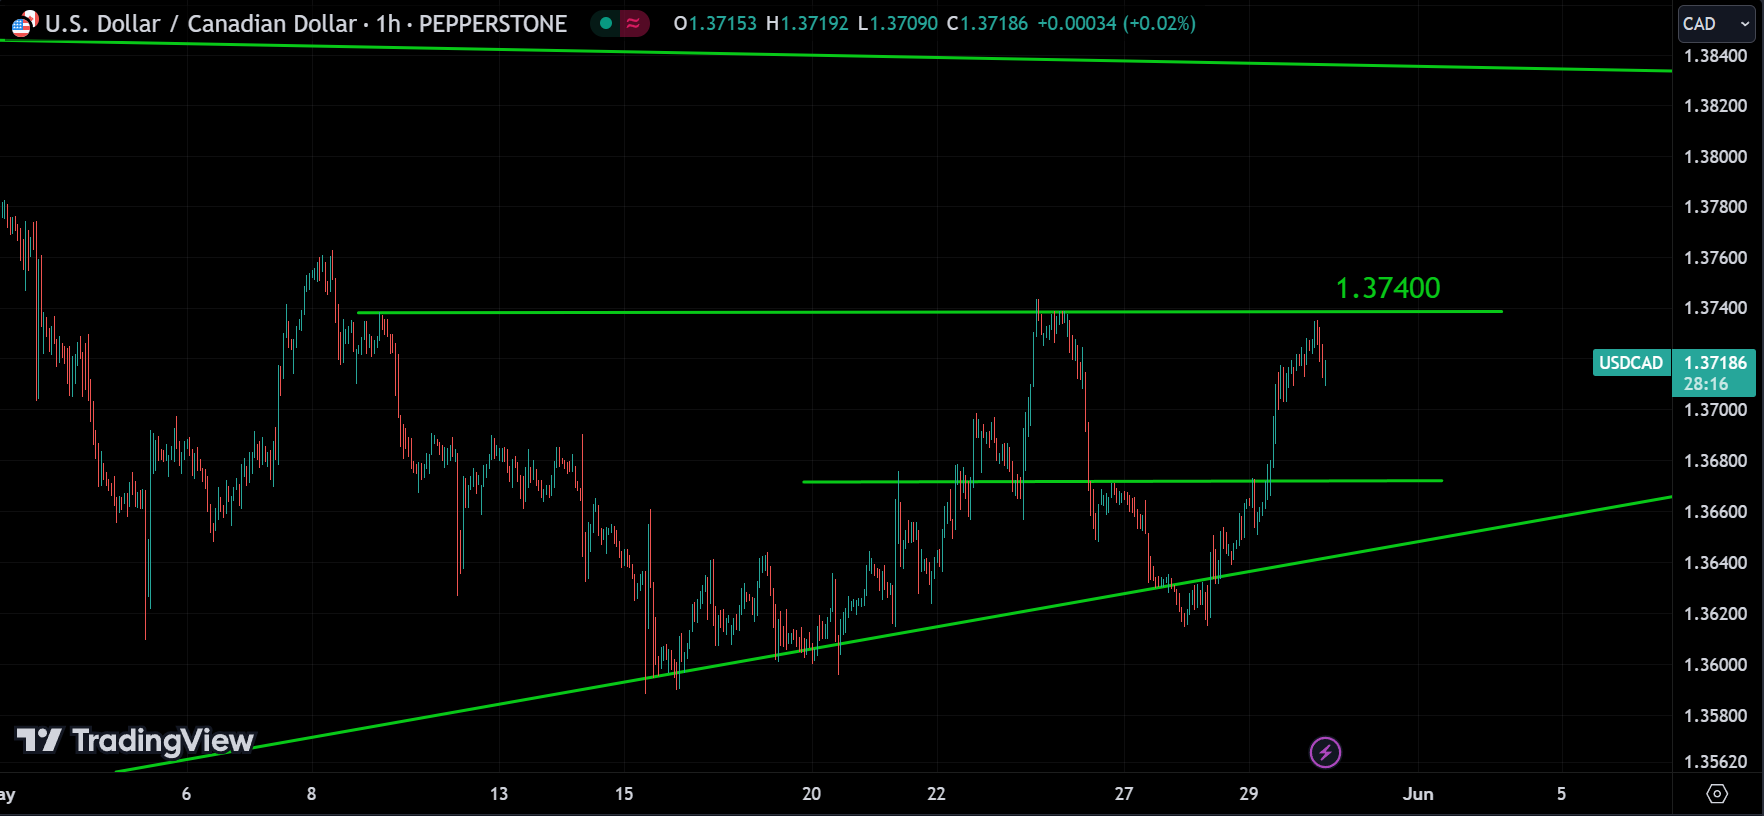
On the 1-hour chart, the price is retracing from its resistance level, meaning it’s correcting. The price might find support around the small trend line or the lower trend line. It has to turn around at one of these levels, or even before that. If the price breaks below the lower trend line, the trend might change.
Keep in mind that the GDP report will impact this pair as well.
USDJPY:
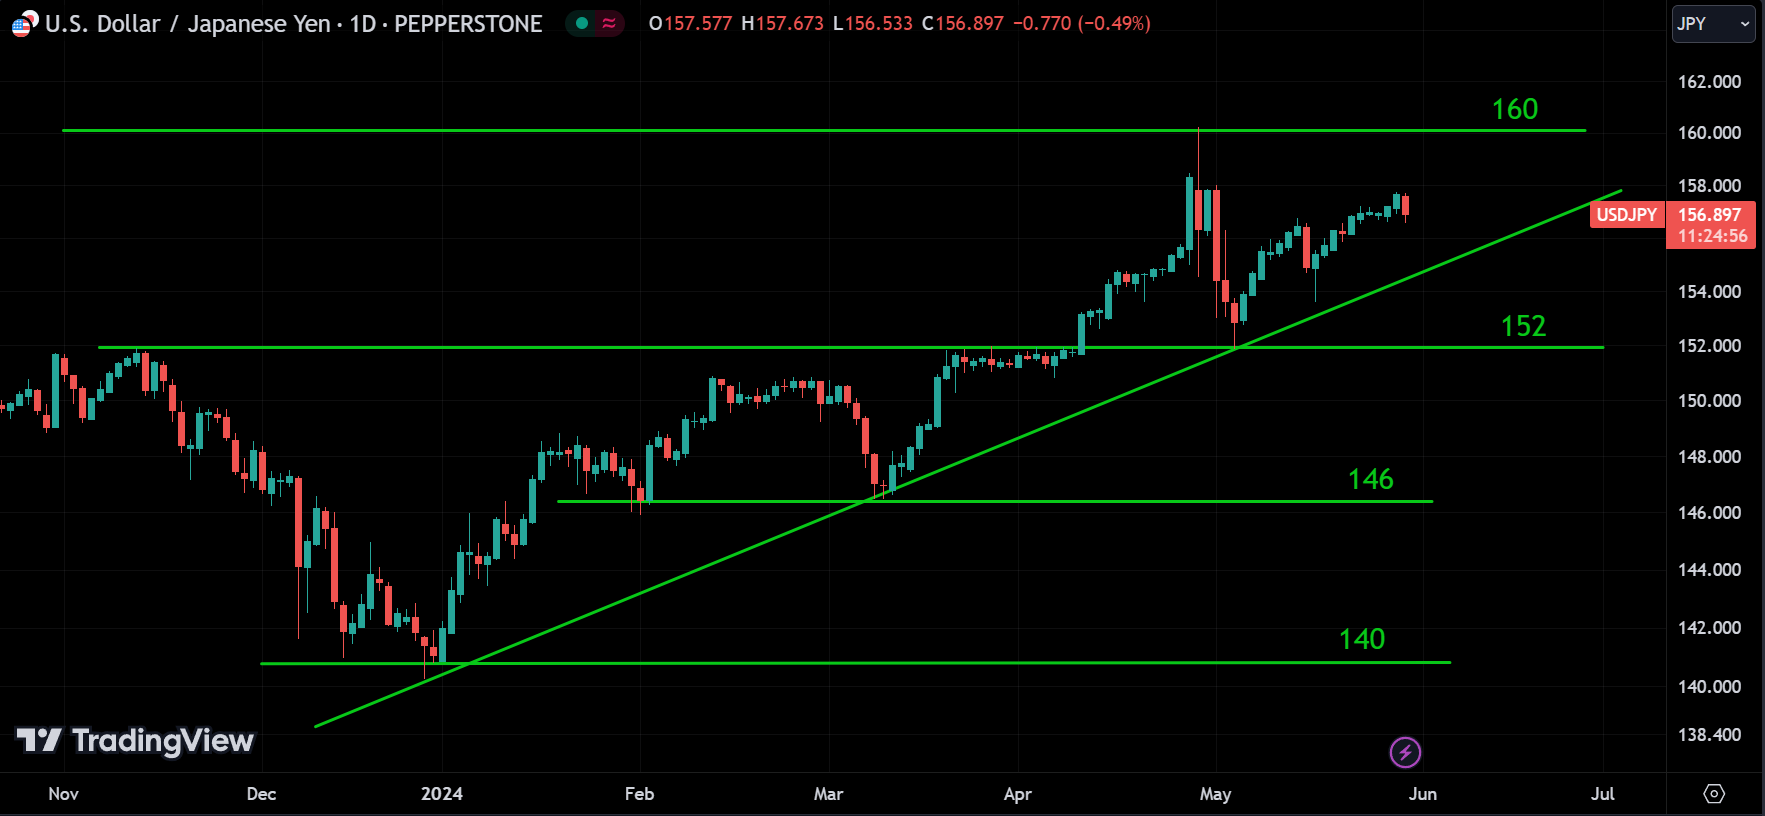
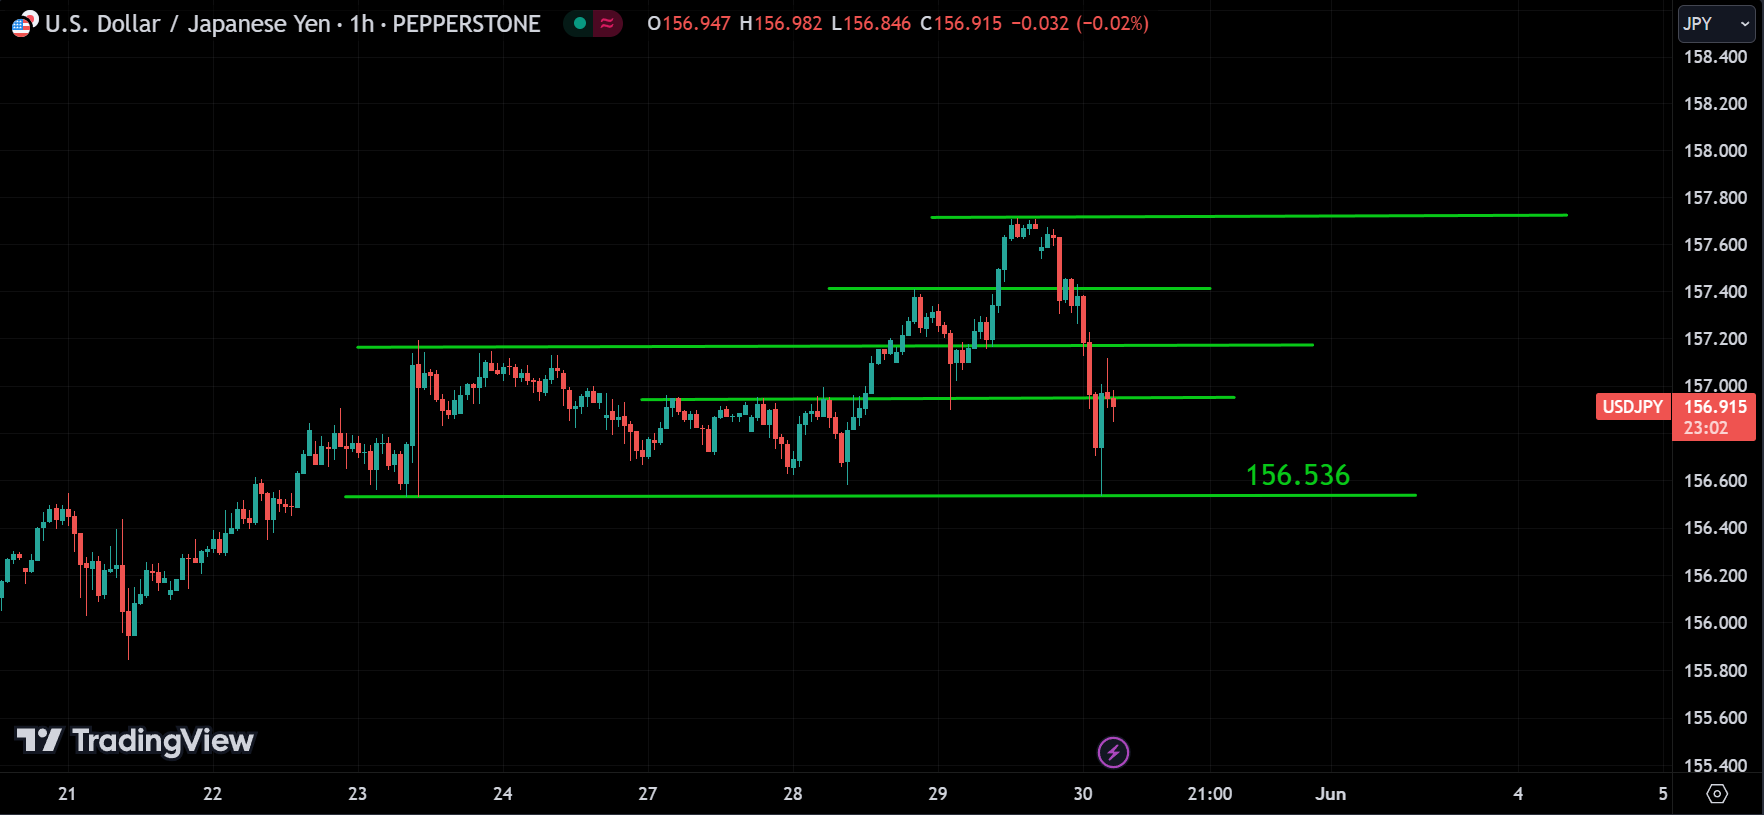
Looking at USD/JPY, the overall trend is bullish. However, on the 1-hour chart, the price suddenly dropped from a high to a support level around 156.536, indicating a correction.
If this correction is over, we can expect the price to go back up from the 156.536 level. However, if the price breaks below this level, it might drop further to the next support level.
Again, Keep in mind that the GDP report will impact this pair as well.
GBPUSD:
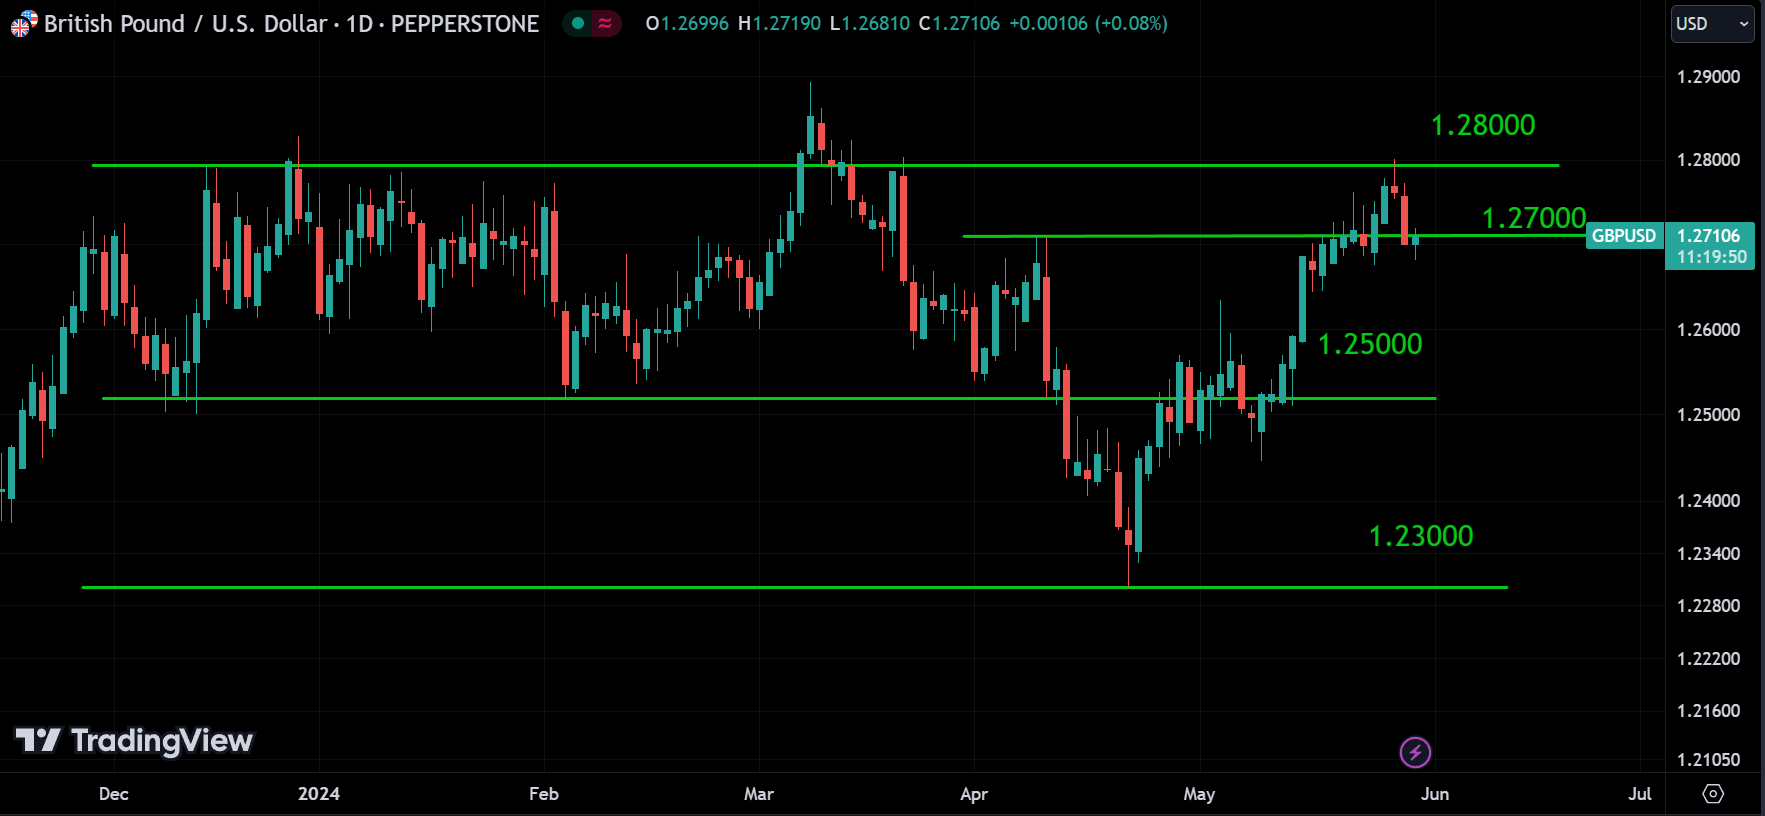
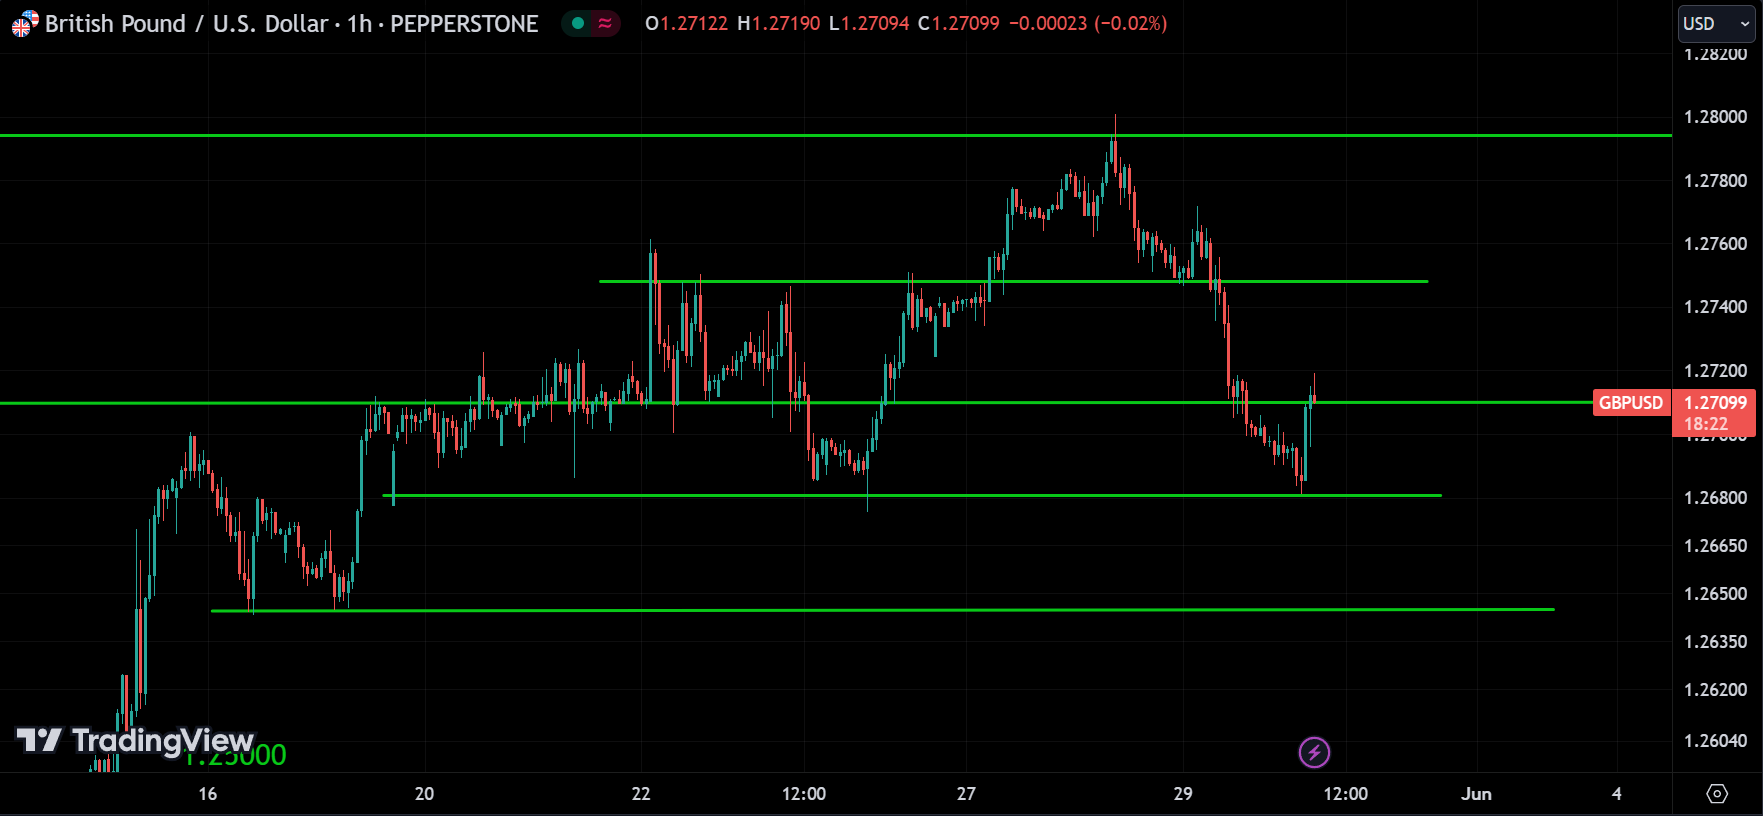
Looking at GBP/USD, it’s still in an uptrend, but there’s a reversal candlestick signal near the high. On the 1-hour chart, the price dropped from the high and found support around the 1.26800 level, then started to go up. If this correction is over, we can expect the price to continue rising. However, if the 1.26800 level is broken, the price might drop to the next support level around 1.26400.
Again, GDP DING DING.
USDCHF:
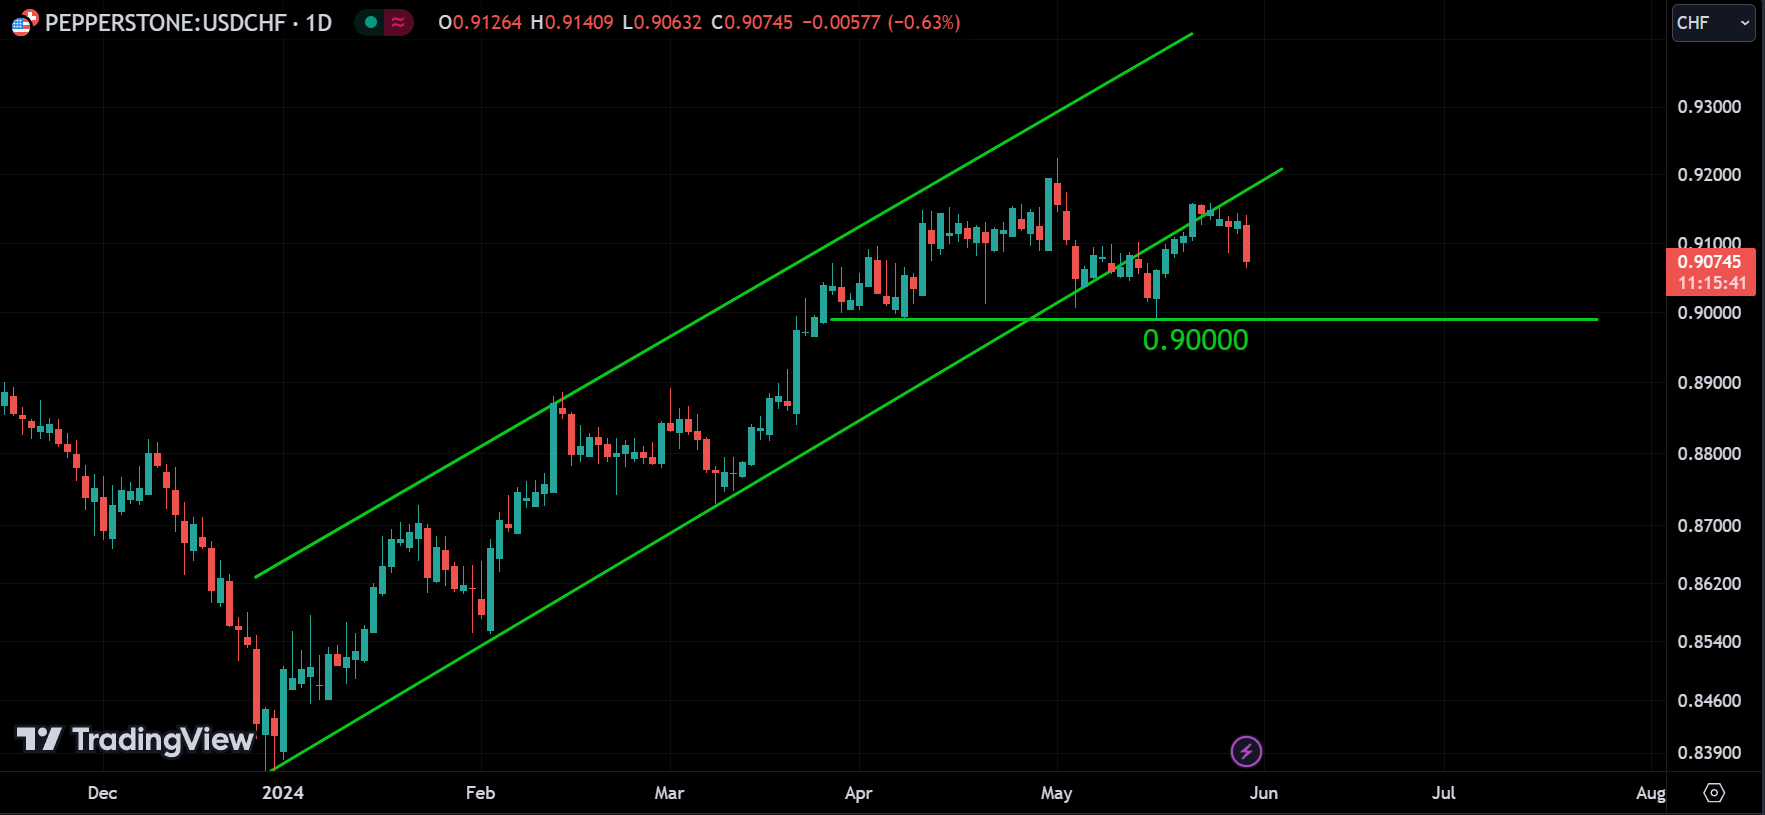
It seems like USD/CHF has indeed broken the channel, indicating it’s either in a downtrend or a sideways trend. The 0.90000 level is a strong support for the price. If this level is broken, we can confirm it’s in a downtrend.
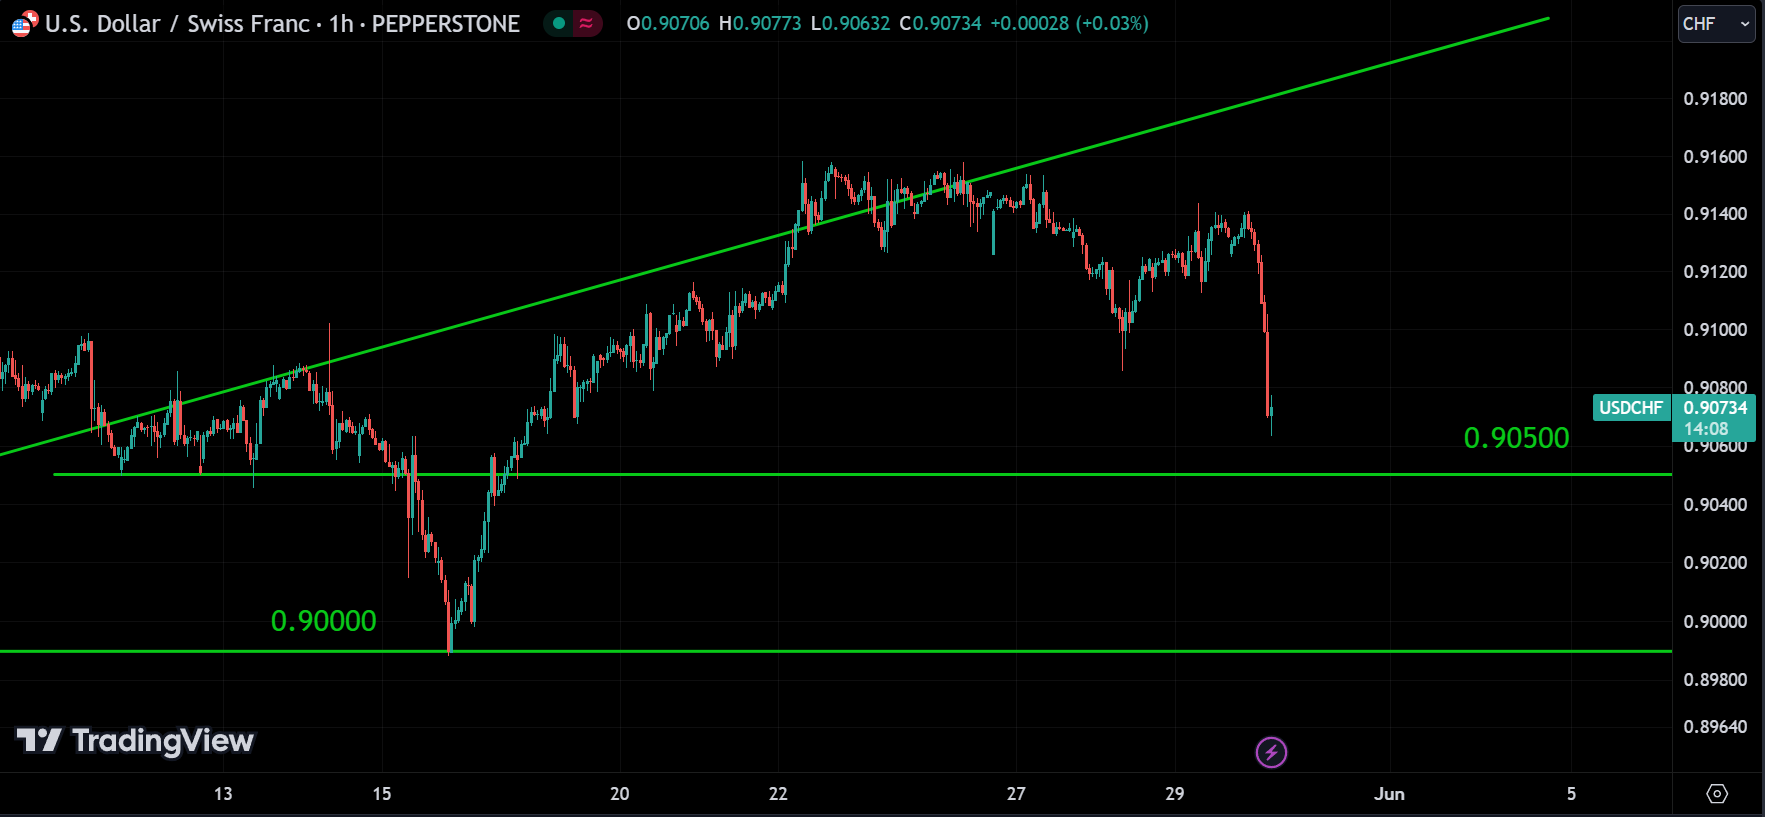
On the 1-hour chart, the price is heading towards the 0.90500 level, where it might find support. If 0.90500 is broken, the price will likely head to the 0.90000 level. If this level is also broken, it will officially confirm the downtrend.
GDP GDP GDP 🎼🎶🎵
AUDUSD:
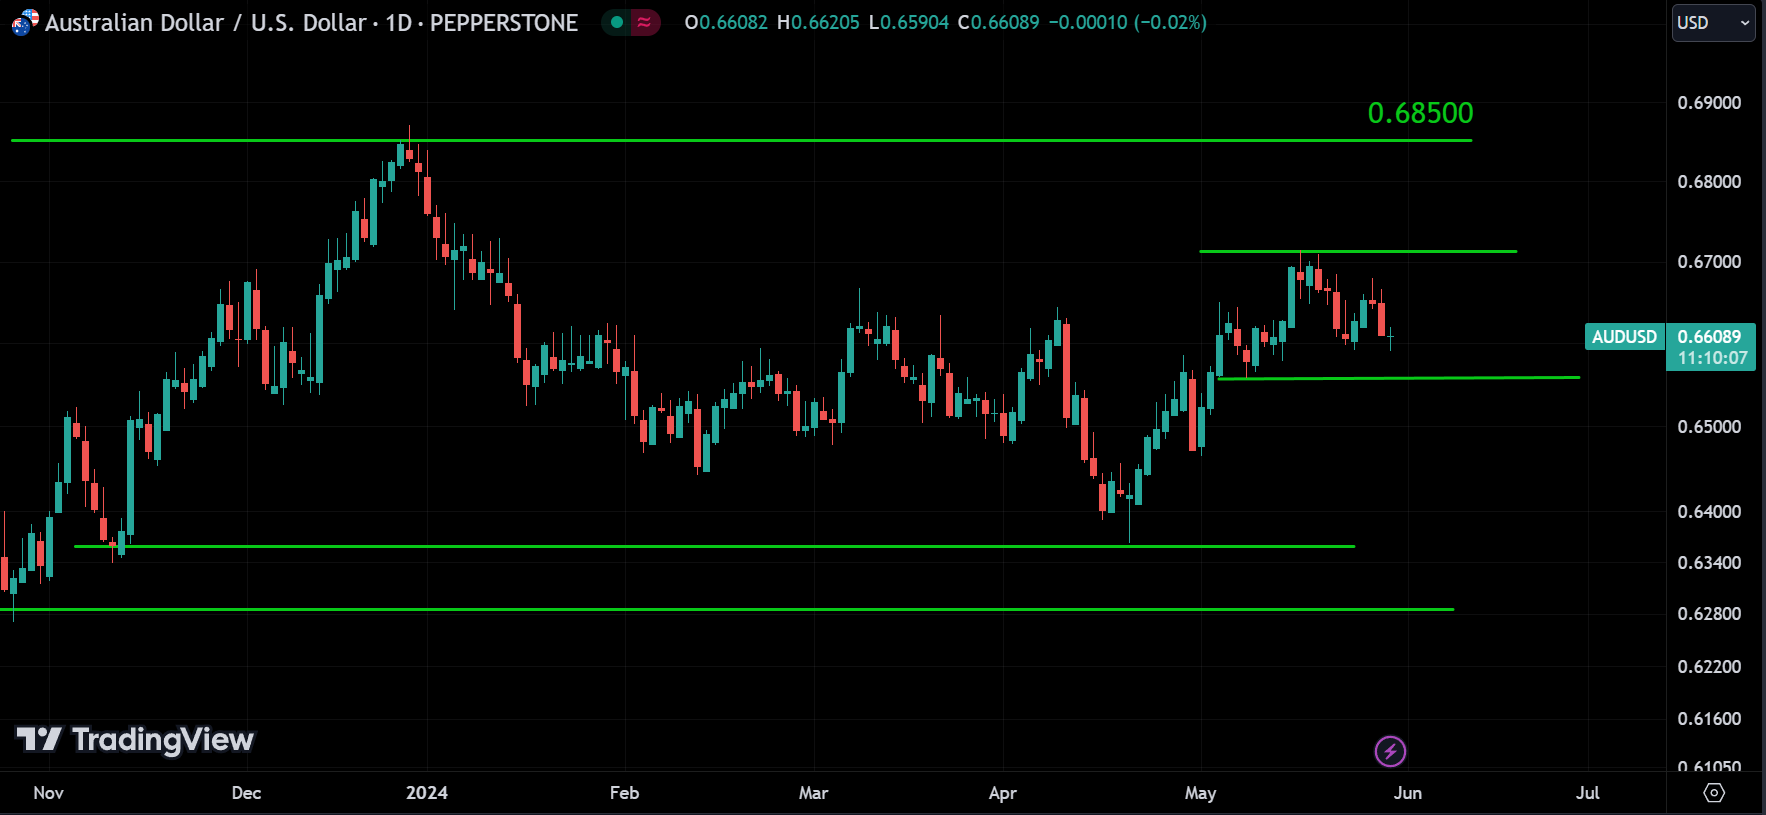
AUD/USD is in an uptrend and currently correcting. The two small trend lines on the daily chart act as support and resistance levels. If the price breaks either of these levels, it indicates a new direction or confirms the current trend.
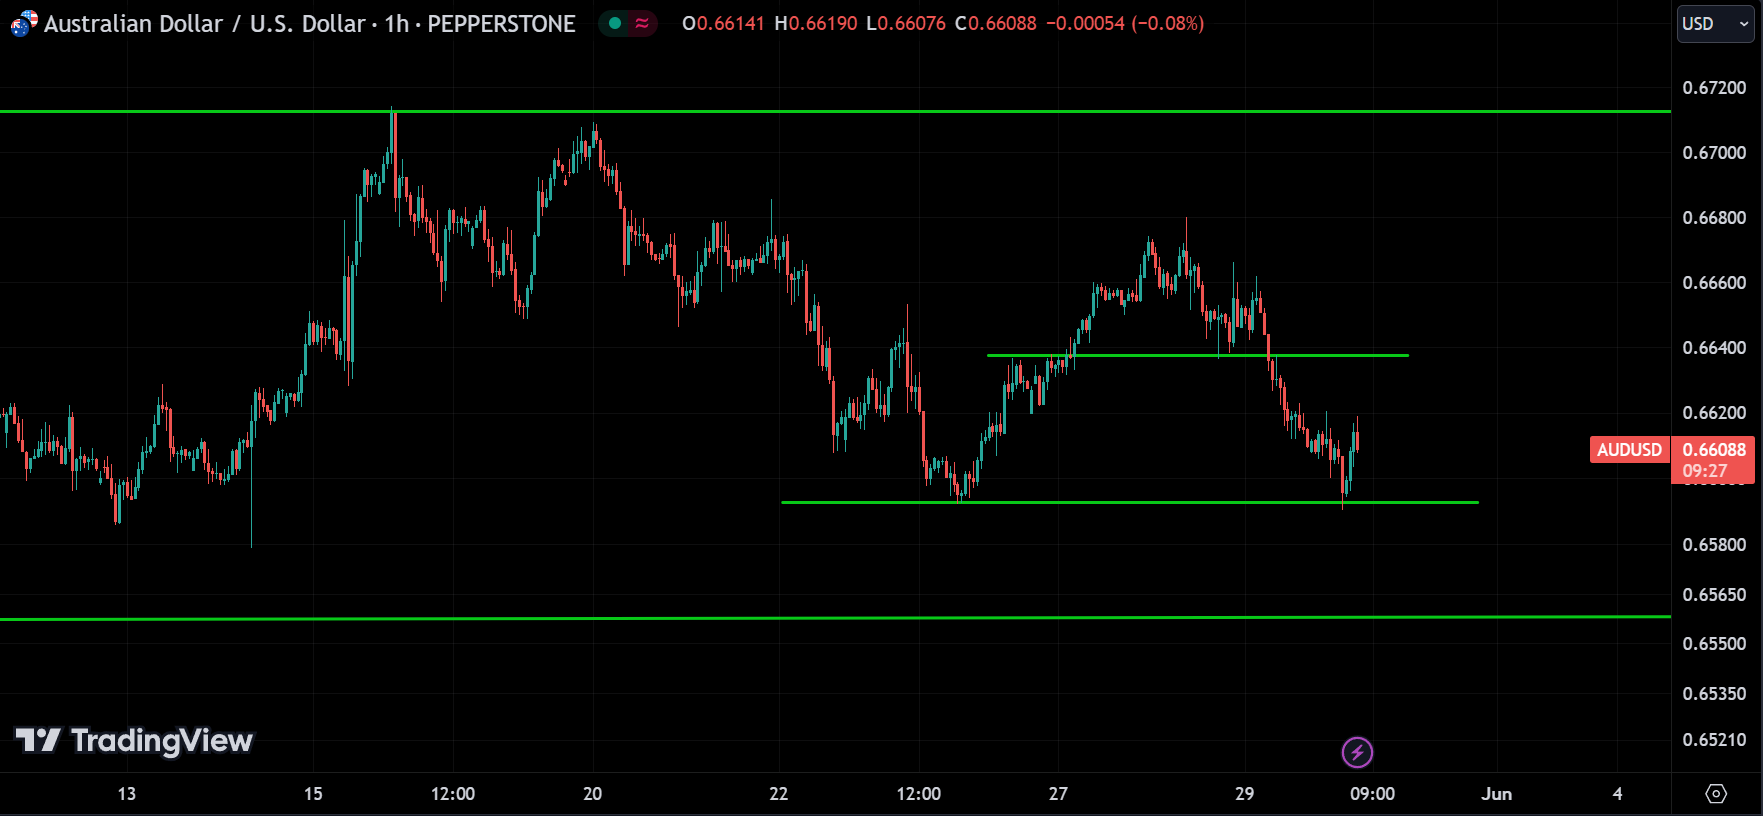
On the 1-hour chart, the price is retracing from its support level. We can expect it to continue rising to the resistance level shown on the chart. If this resistance level is broken, the price may keep going up. However, if the support level is broken, the price might drop further.
NZDUSD:
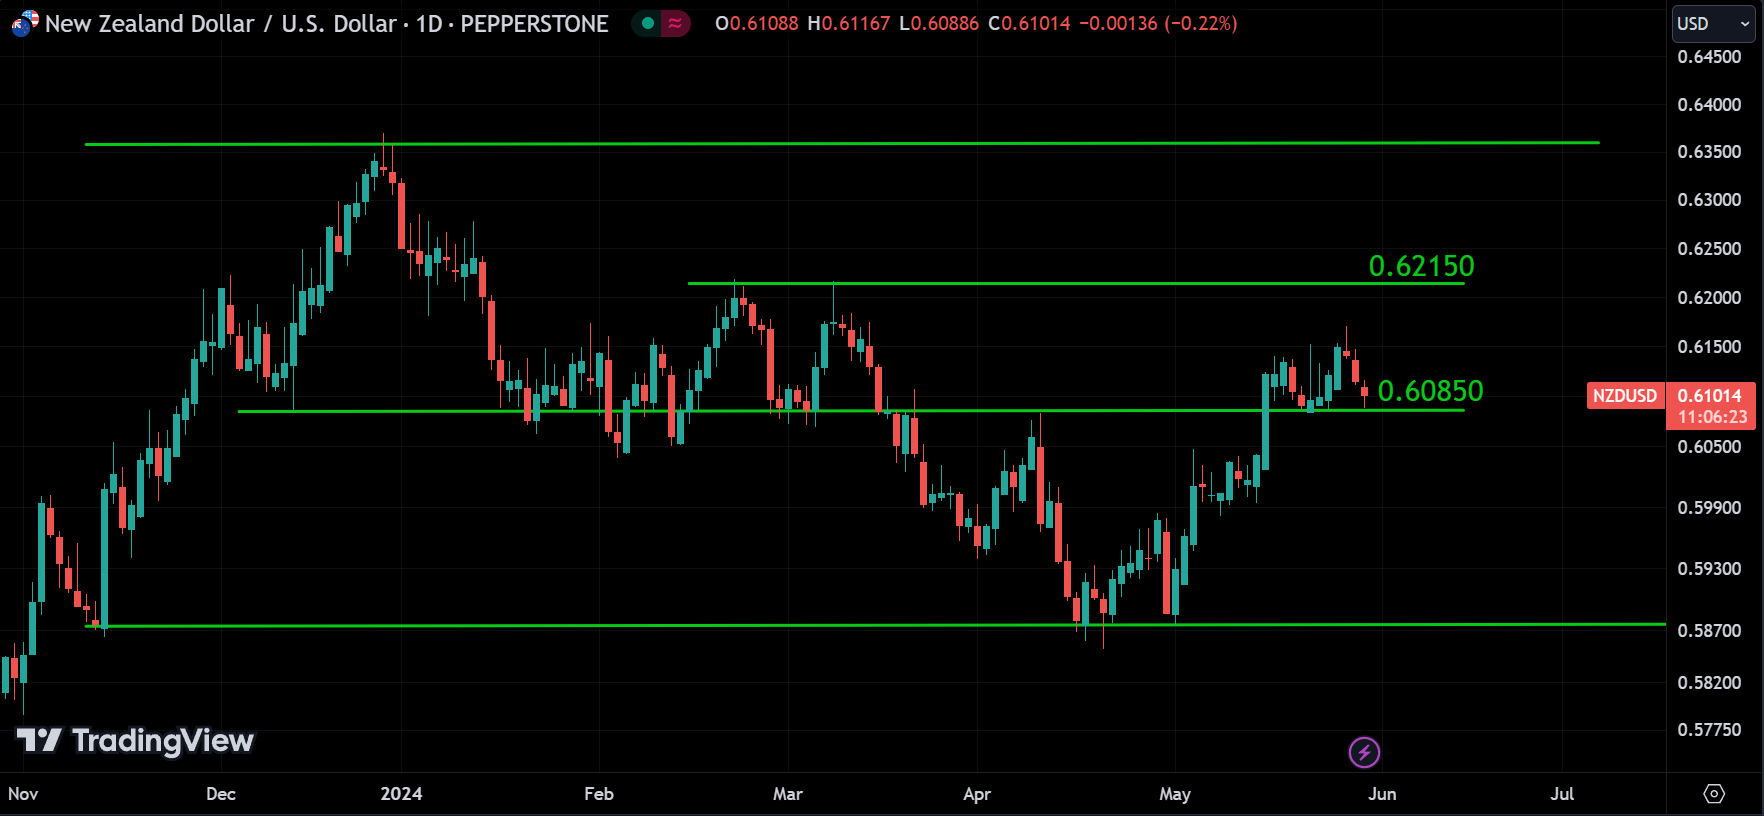
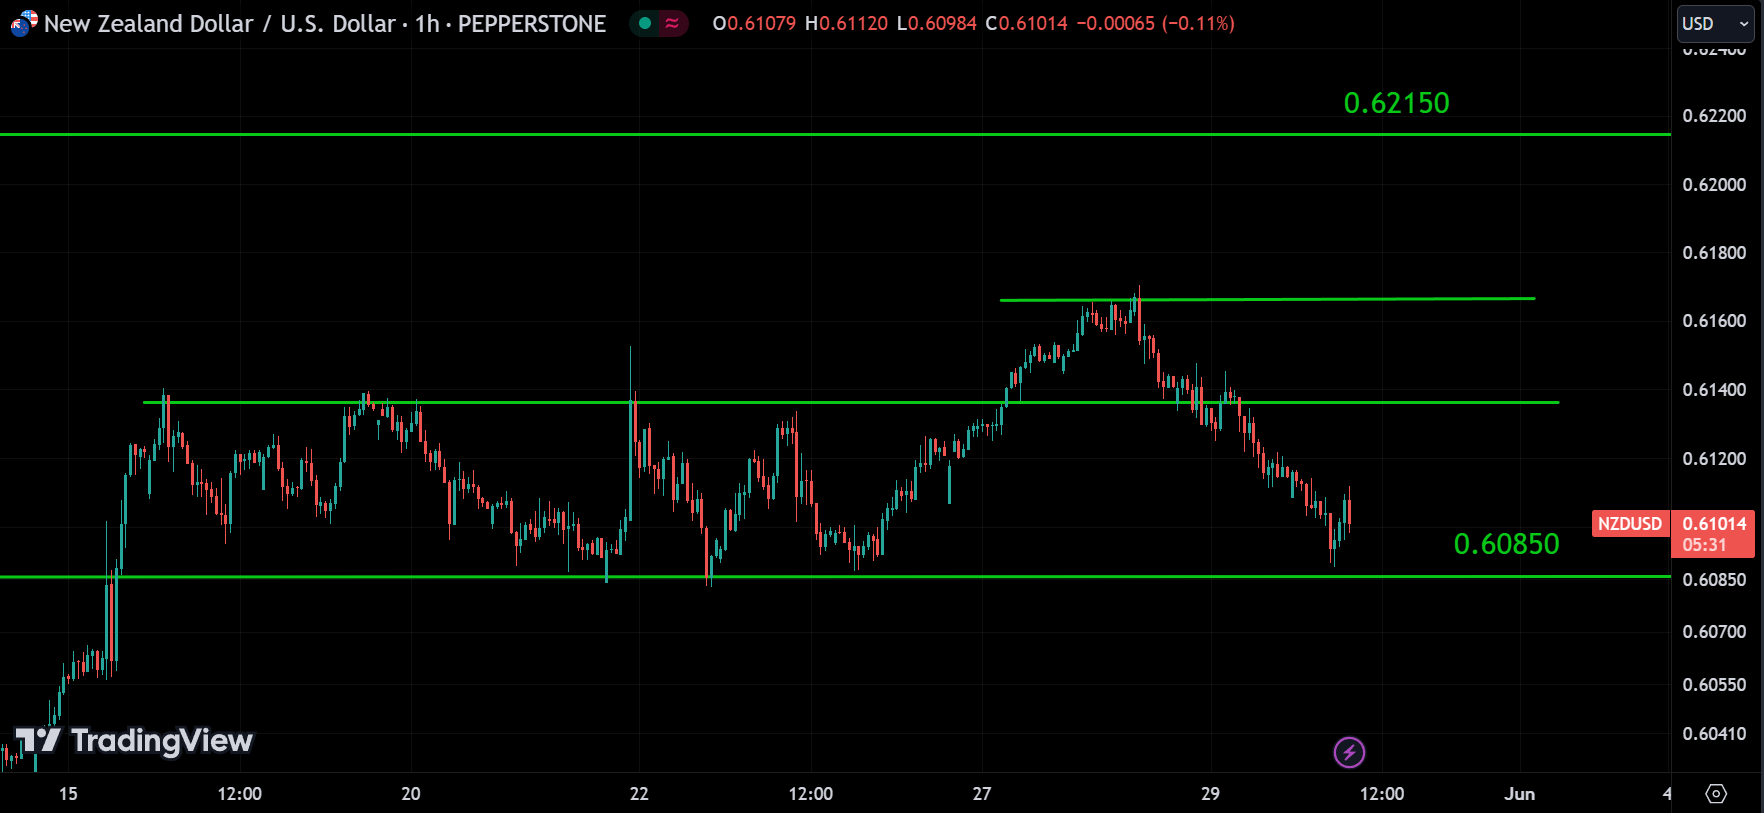
Looking at NZD/USD, it’s still in an uptrend and trading near its support level. We can expect the price to keep rising from this level to the next resistance levels indicated on the 1-hour chart. However, if the price breaks below the 0.60850 support level, it may drop further.
Since all the pairs mentioned above involve the USD, they will all be affected by the GDP report. If you are trading today, trade safely.
Disclaimer
The information provided in this market analysis is for educational and informational purposes only. It should not be construed as financial advice or a recommendation to buy, sell, or hold any securities or investments.
All investments involve risk, and past performance is not indicative of future results. The analysis provided may not be suitable for all investors and should be used at their own discretion.
These analyses are here to help you understand how to analyze the market. They’re not about giving buy or sell signals. It’s simply about observing market behavior. I don’t recommend when to buy or sell because trading doesn’t work that way. You need a strategy to guide your decisions about when to enter or exit positions. That’s the key to making consistent profits in the financial markets over time.
I discussed these sectors and markets because when the entire market or sector goes through certain movements, most of the stocks within that market will also experience similar movements. So, by understanding what the market is doing, you can conduct your own analysis on specific coins or stocks.
Readers are encouraged to conduct their own research.
Trading and investing in financial markets carry inherent risks, including the risk of losing invested capital. It is important to carefully consider your investment objectives, risk tolerance, and financial situation before making any investment decisions.
GOOD LUCK!!!