

Hello, Welcome to our Market Analysis Today Article. It’s Monday, 27th last week of May 2024. It’s Memorial Day, US stock markets and banks are closed. although crypto trades 24/7, this week is going to be an interesting week for crypto.
Key Trading Events Today
These events encompass important global news, macroeconomic reports, and economic indicators. For more details, you can check the Bloomberg Calendar.
No trading is happening in the United States because all the banks and exchanges are closed for Memorial Day, as mentioned earlier.
Besides that, there are no major events today that could significantly impact the markets.
FOREX
EURUSD:
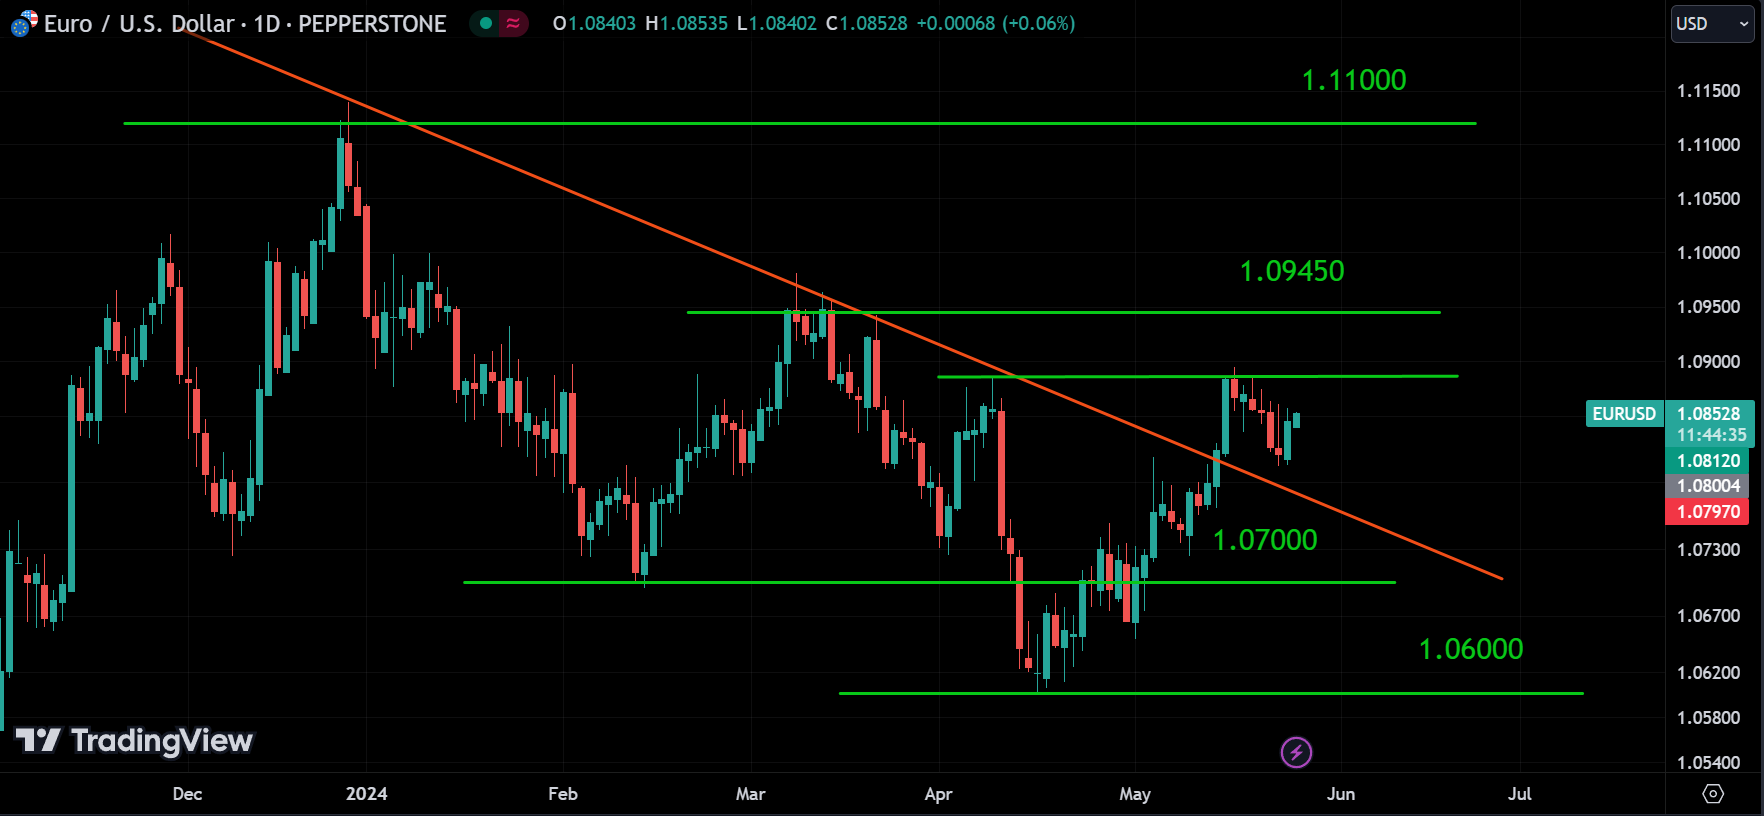
For the EUR/USD pair, the daily chart shows that the price has broken above the red downtrend line, indicating that the trend has reversed and is now in an uptrend. After breaking this level, the price went into a correction, dropping down but then bouncing back up from the red line.
We can expect the price to continue rising with the uptrend. Currently, it is still in the correction phase. Remember, the red line now acts as a support for the price, while the small green line acts as a resistance.
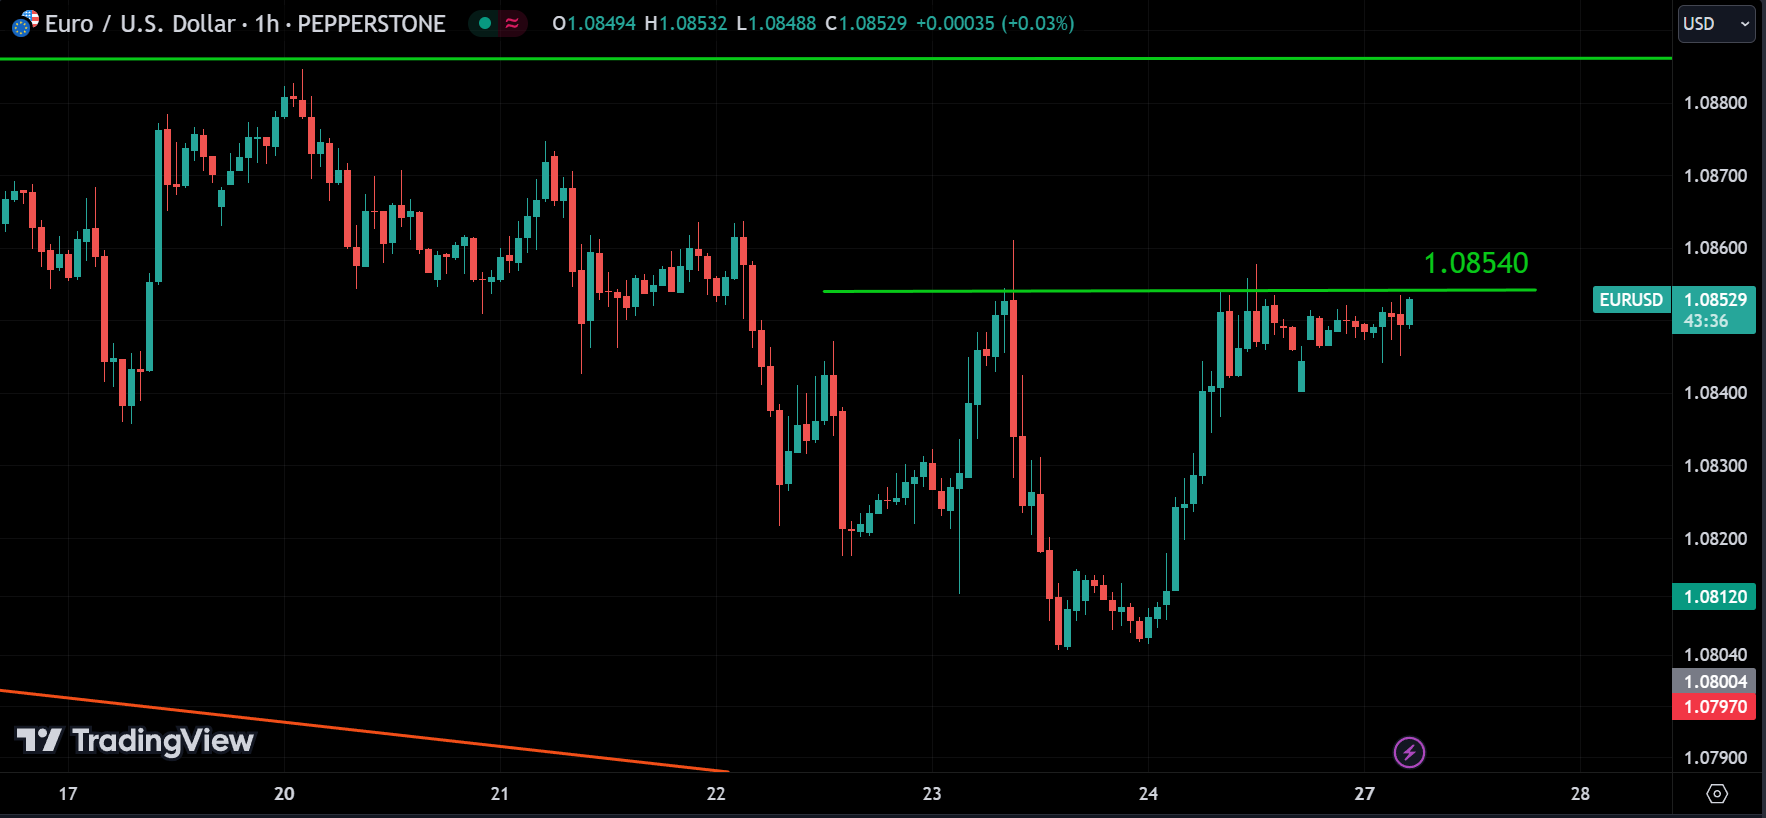
If we look at the 1-hour chart, there’s a strong resistance level around 1.08540. The price has tried and failed to break this level several times, and it also doesn’t seem to want to drop far from it.
There are two possible scenarios here:
- The price breaks above the green resistance line and continues to rise, although there may be corrections along the way.
- The price retraces from the green line and drops further.
If you want to go long, wait for a breakout to confirm. If you want to go short, wait for any reversal signals before entering a position.
USDCAD:
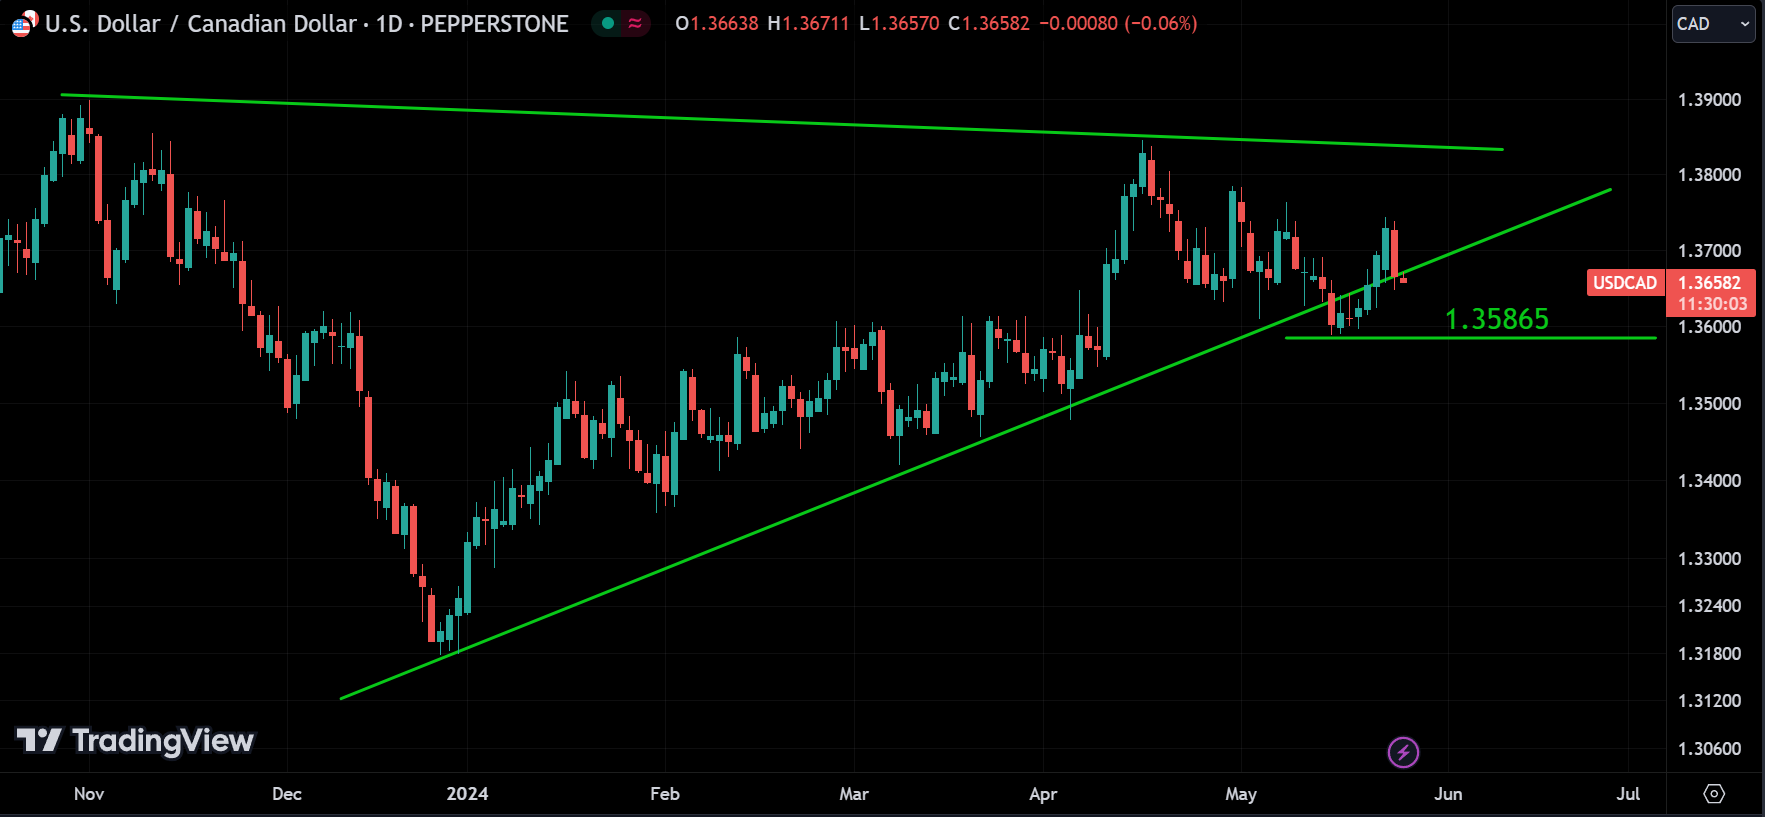
Looking at the USDCAD, it seems to be in an uptrend, but it recently broke below the trend line and then moved back up to trade at that line. The 1.35865 level appears to be strong support.
What we can expect now is:
- If the price breaks below 1.35865, USDCAD could enter a downtrend.
- On the other hand, it could continue to rise.
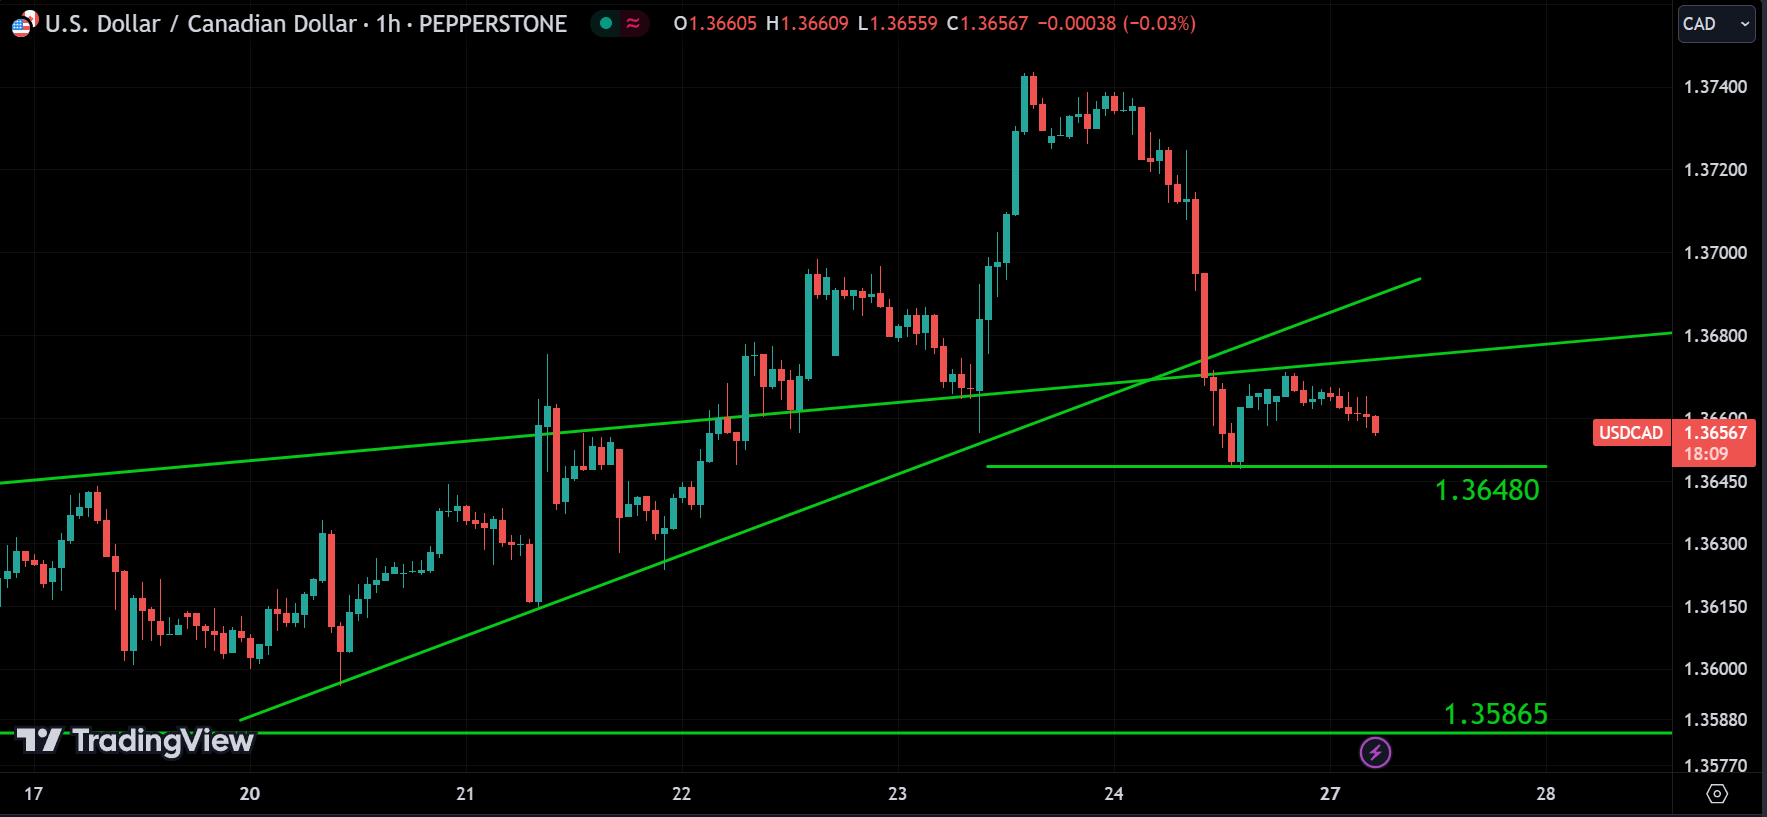
Looking at the 1-hour chart, if the price breaks below 1.36480, we can expect it to drop to 1.35865. Alternatively, it could bounce back up from the 1.36480 level. So, wait for confirmation before entering a position.
USDJPY:
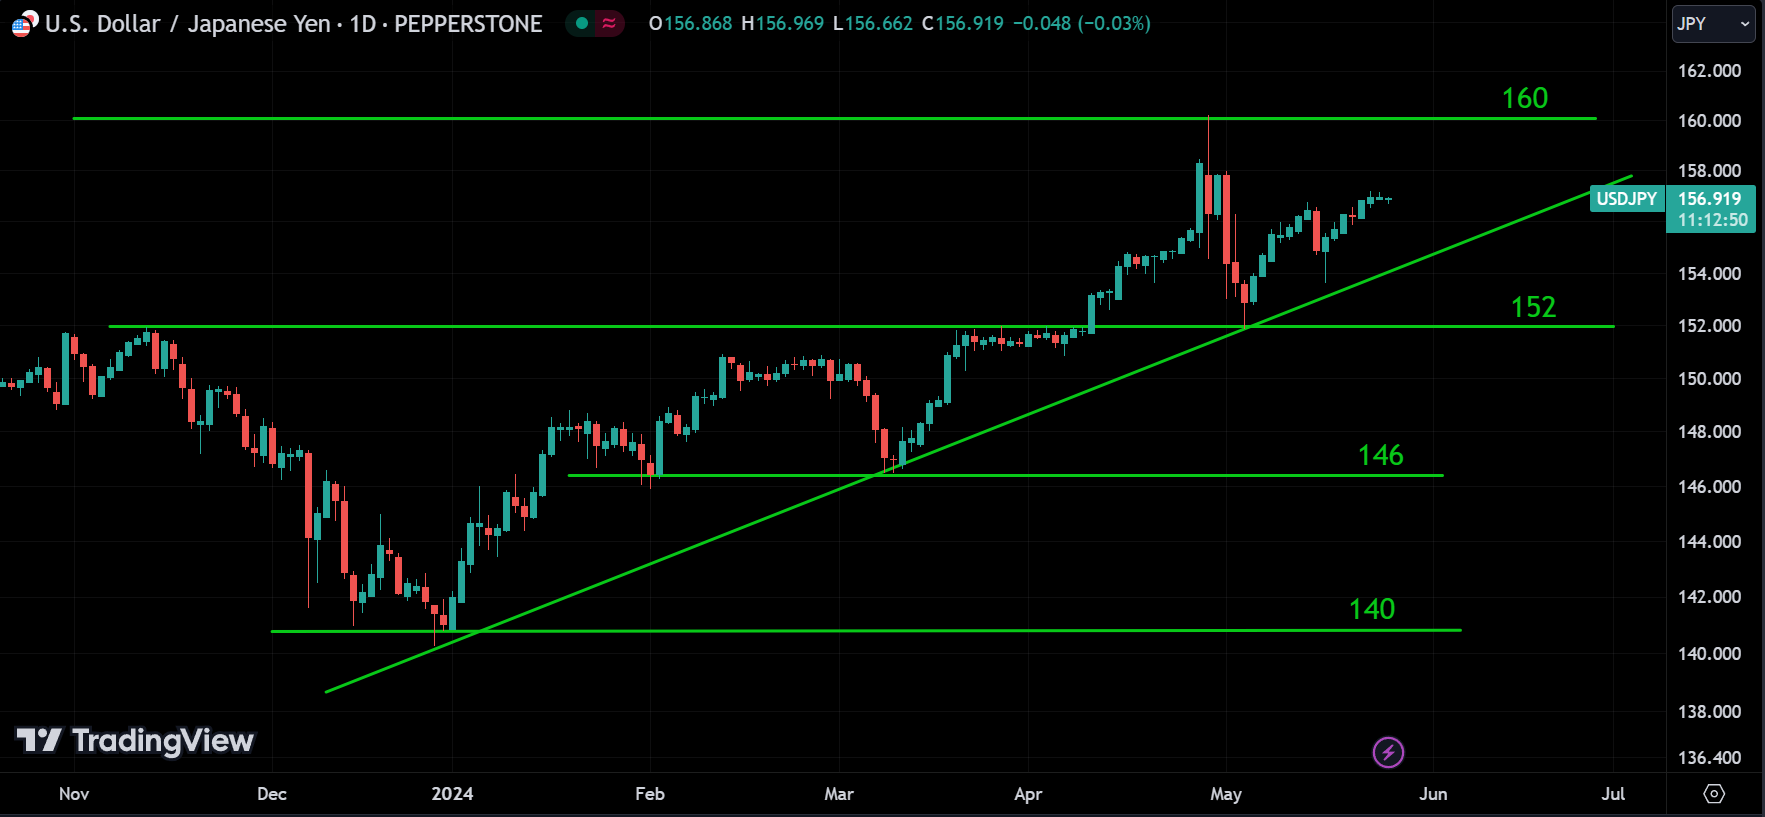
Witness the power of the trend. USD/JPY has been in an uptrend since January and is still going strong, heading towards the 160 level. The green slope trend line acts as a support for the price. As long as this line isn’t broken, the uptrend continues.
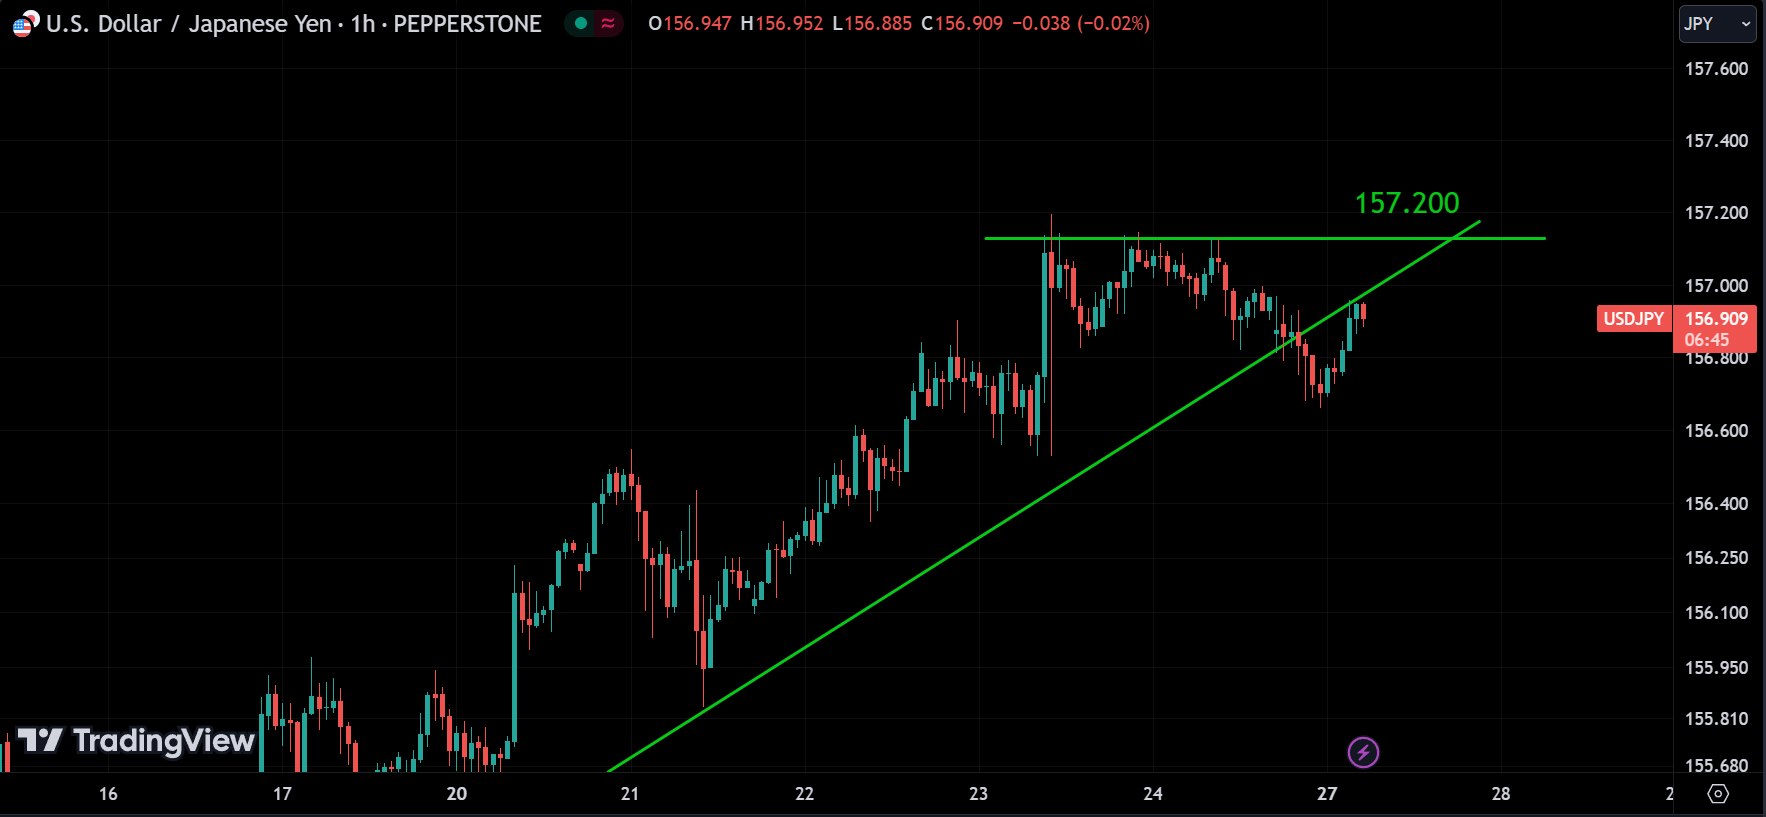
The 157.200 level serves as strong resistance for the price. If you want to take a long position, wait for the price to break above this level before entering. The price may also reverse from this level, so only enter a position after confirmation.
USDCNH:
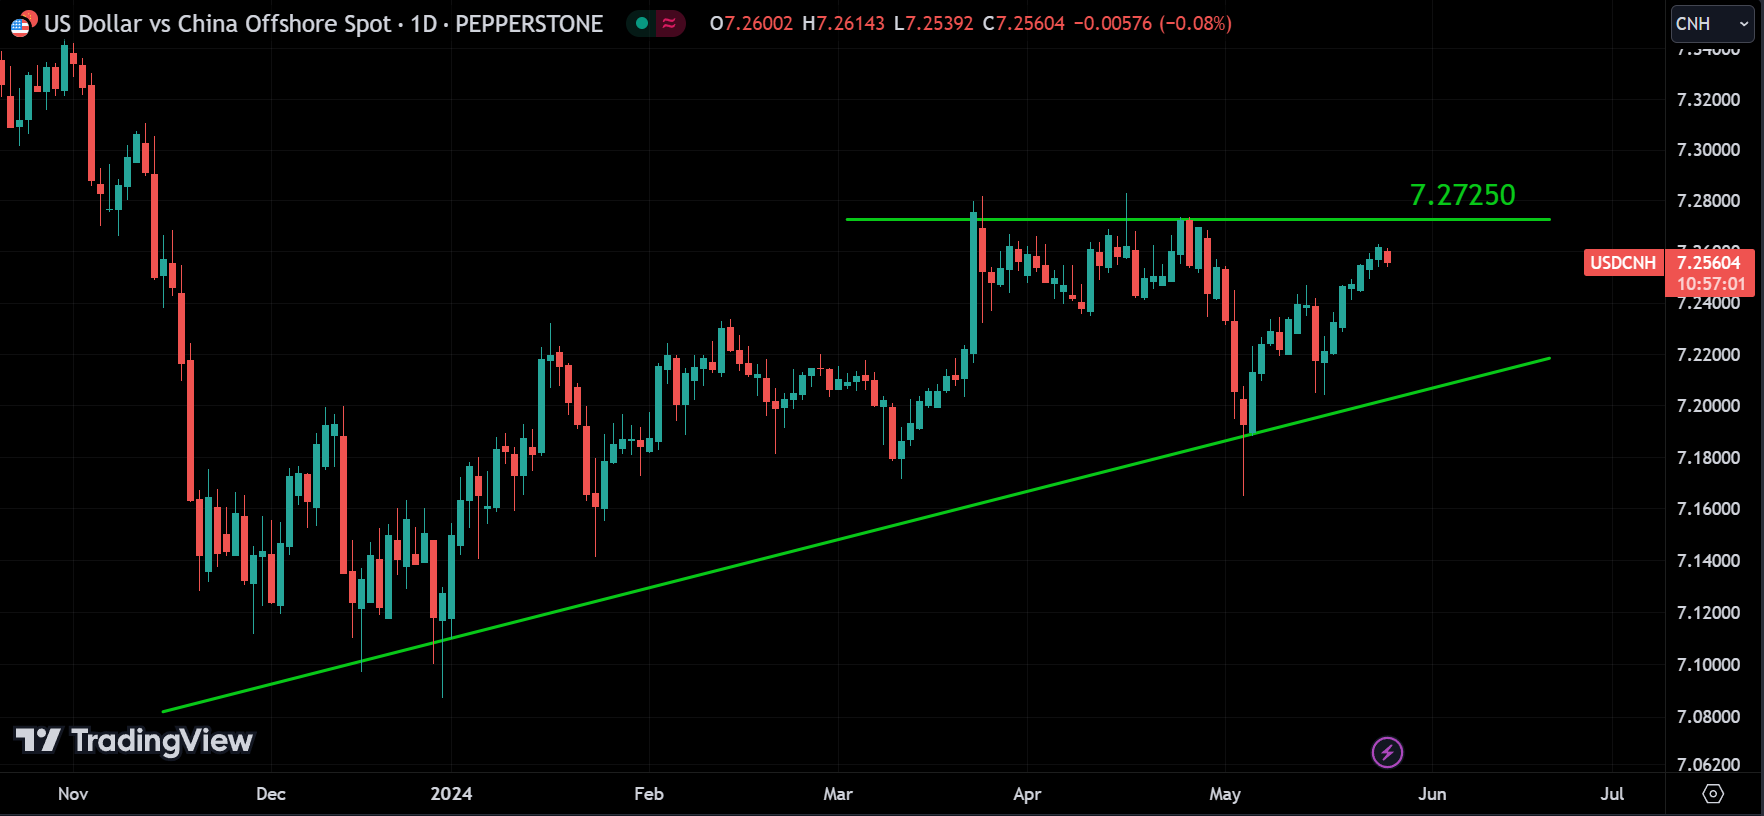
It looks like USDCNH is in an uptrend, with 7.27250 as a strong resistance level. There are two possible scenarios:
- The price breaks above 7.27250 and continues to rise, possibly with some corrections.
- The price retraces from the 7.27250 level.
USDSGD:
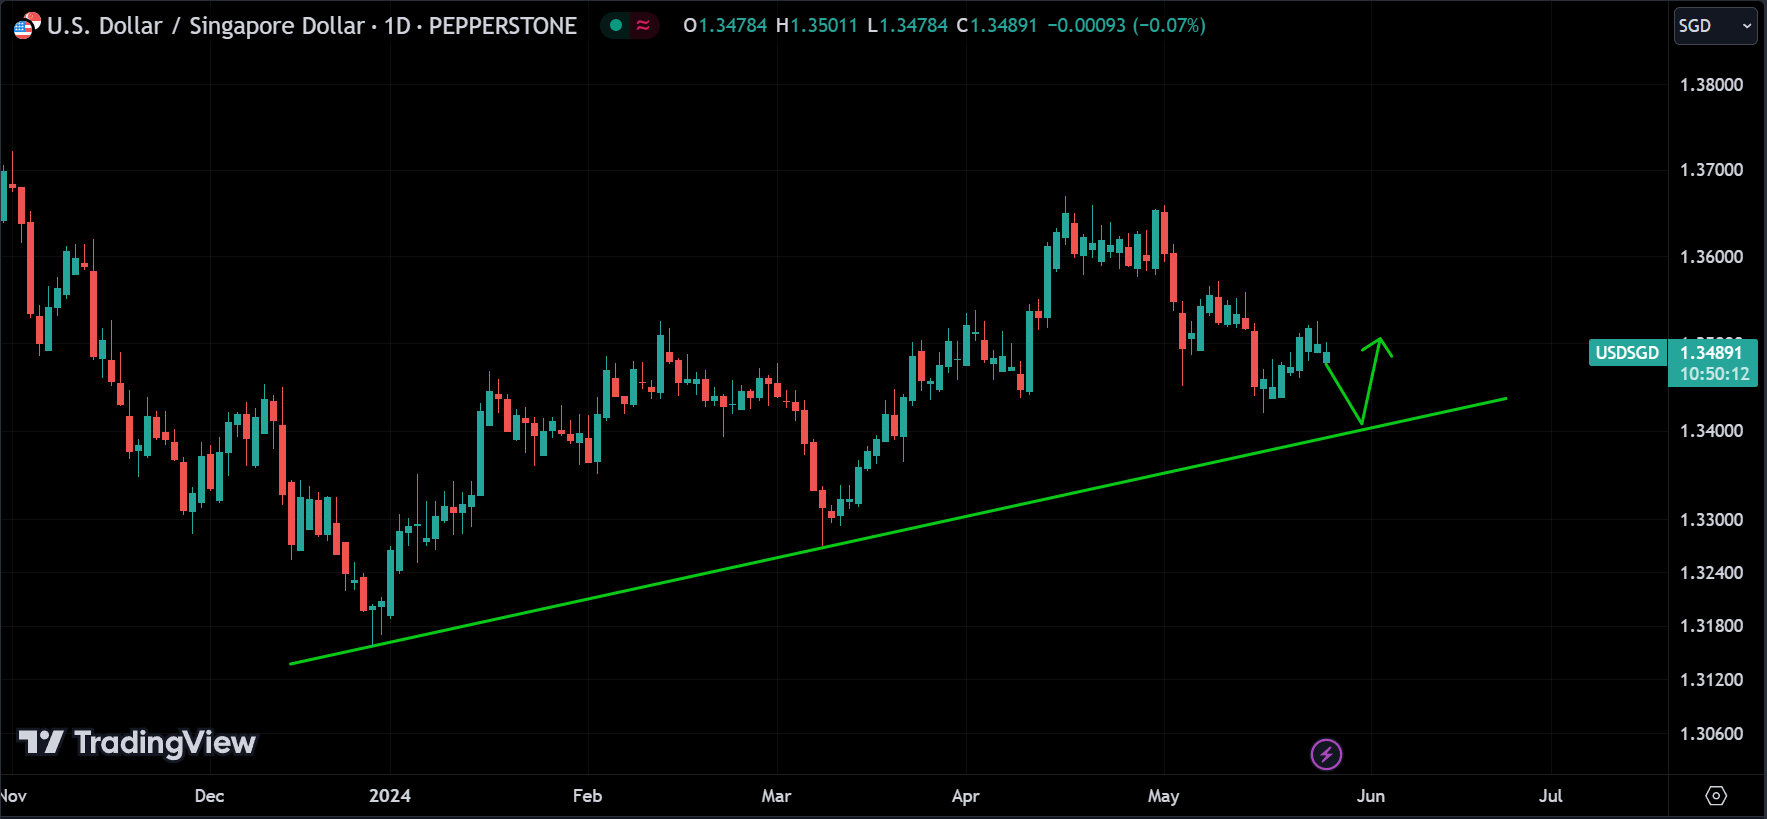
The overall long-term trend for USDSGD is bullish, but right now, it seems to be trading downward in the medium term. We can expect the price to either reach the lower trend line and then bounce back up or break the lower trend line and continue to drop.
USDINR:
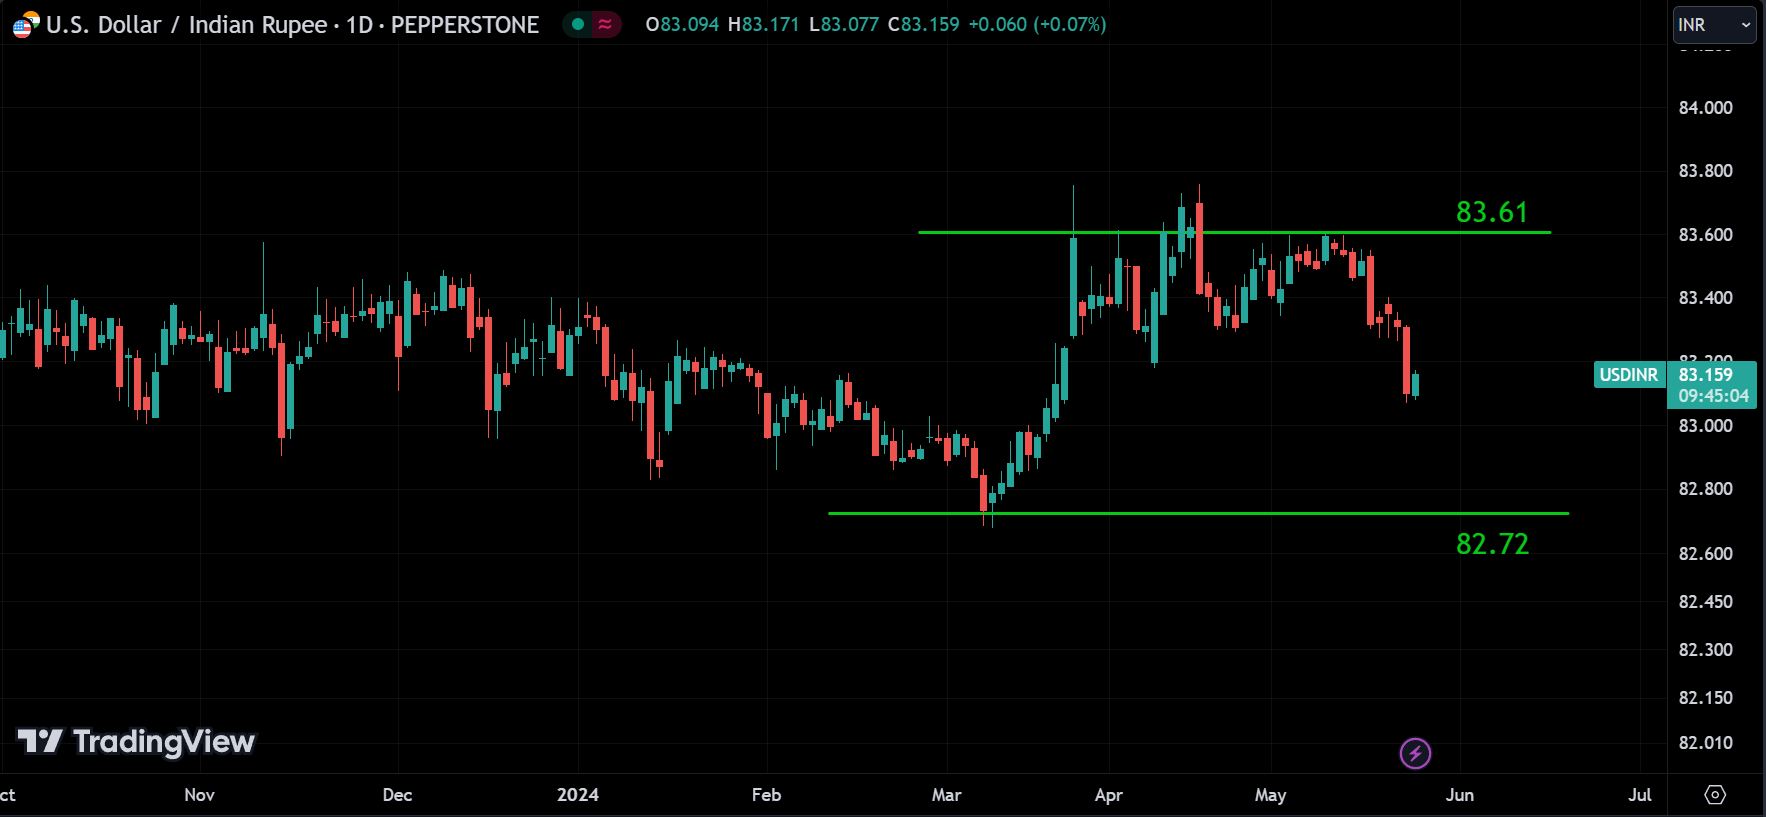
After trying to break the 83.60 level, USDINR couldn’t succeed and started to fall. So, 83.60 acts as a strong resistance to the price. We can expect it to decrease to the 82.72 range. Watch out for any reversal signals or breakouts to confirm the trend.
CRYPTO
BTC:
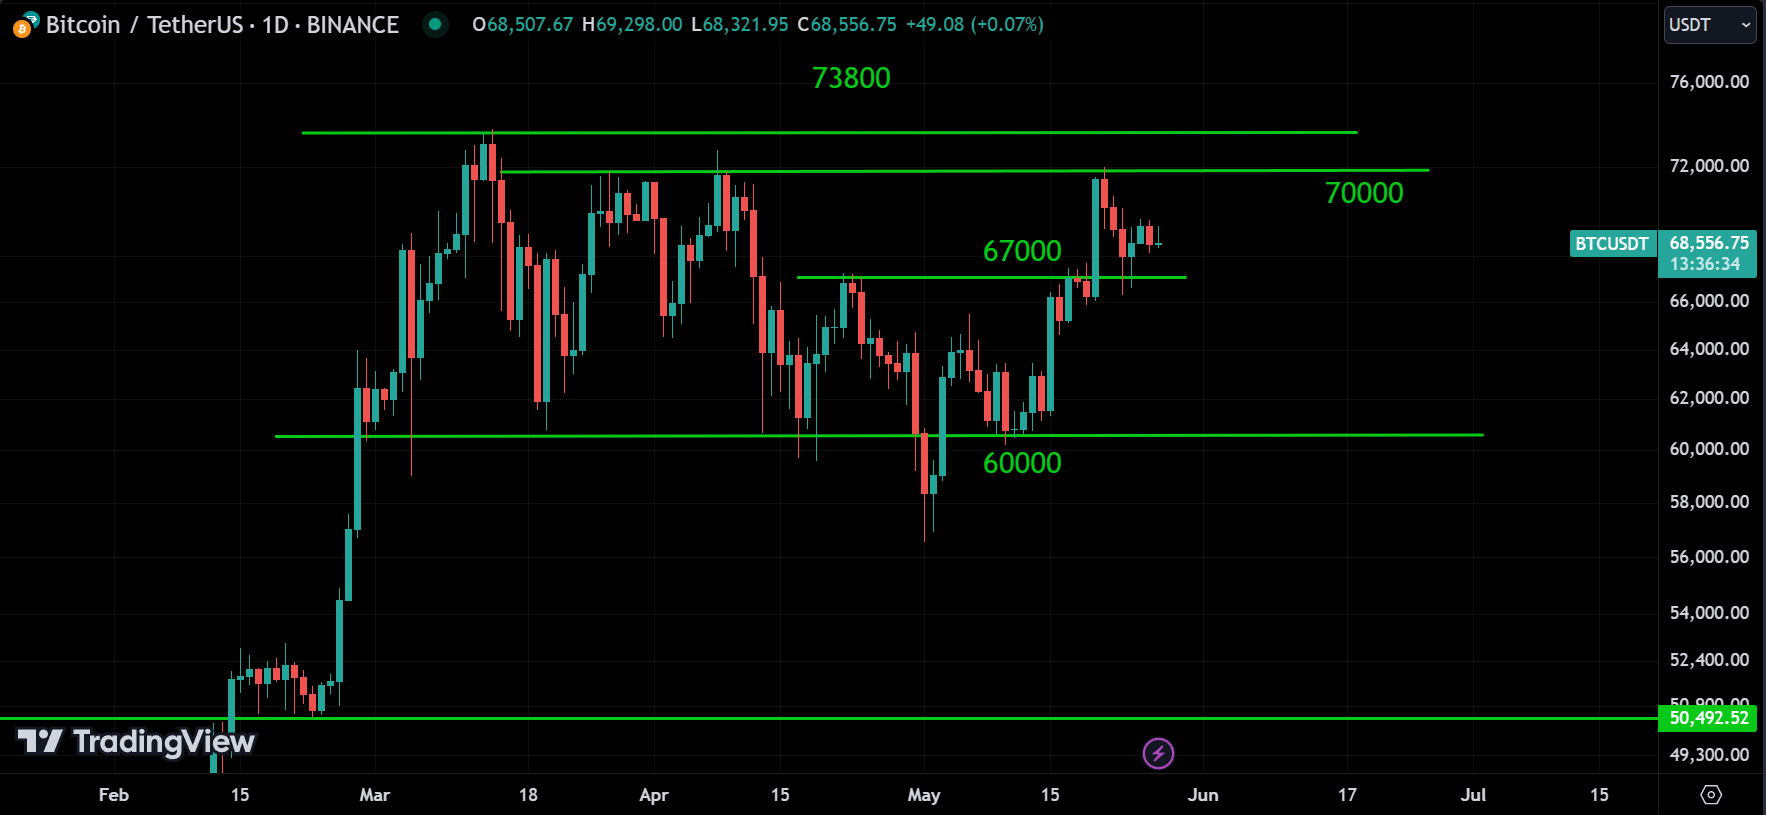
Observing BTC, it returned to the 70k range before declining, with 67k appearing to support the price. Currently, the price is trading between 70k and 67k. I anticipate the price breaking upward. However, as it resembles more of a sideways trend, it could also drop below 67k. The trend will be determined by the breakout, so wait for it to happen.
ETH:
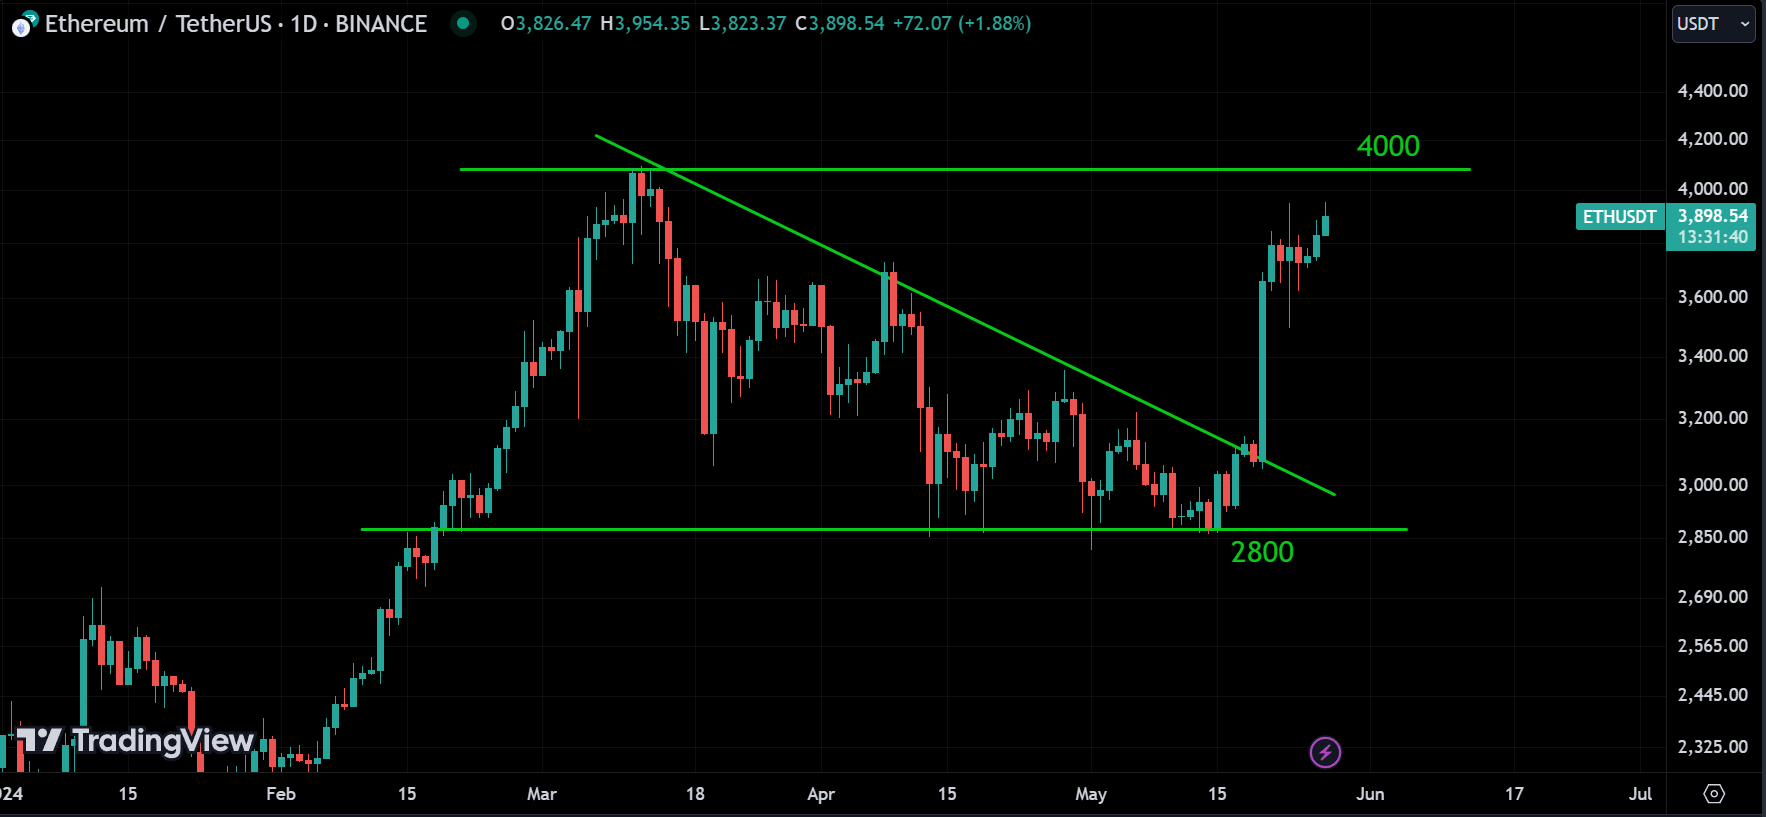
Looking at Ethereum, it’s heading towards the 4000 mark. We can expect a reversal or correction from there, but it seems like it’s definitely aiming for the 4k milestone. If it breaks the 4k level, we can anticipate it going even higher.
BNB:
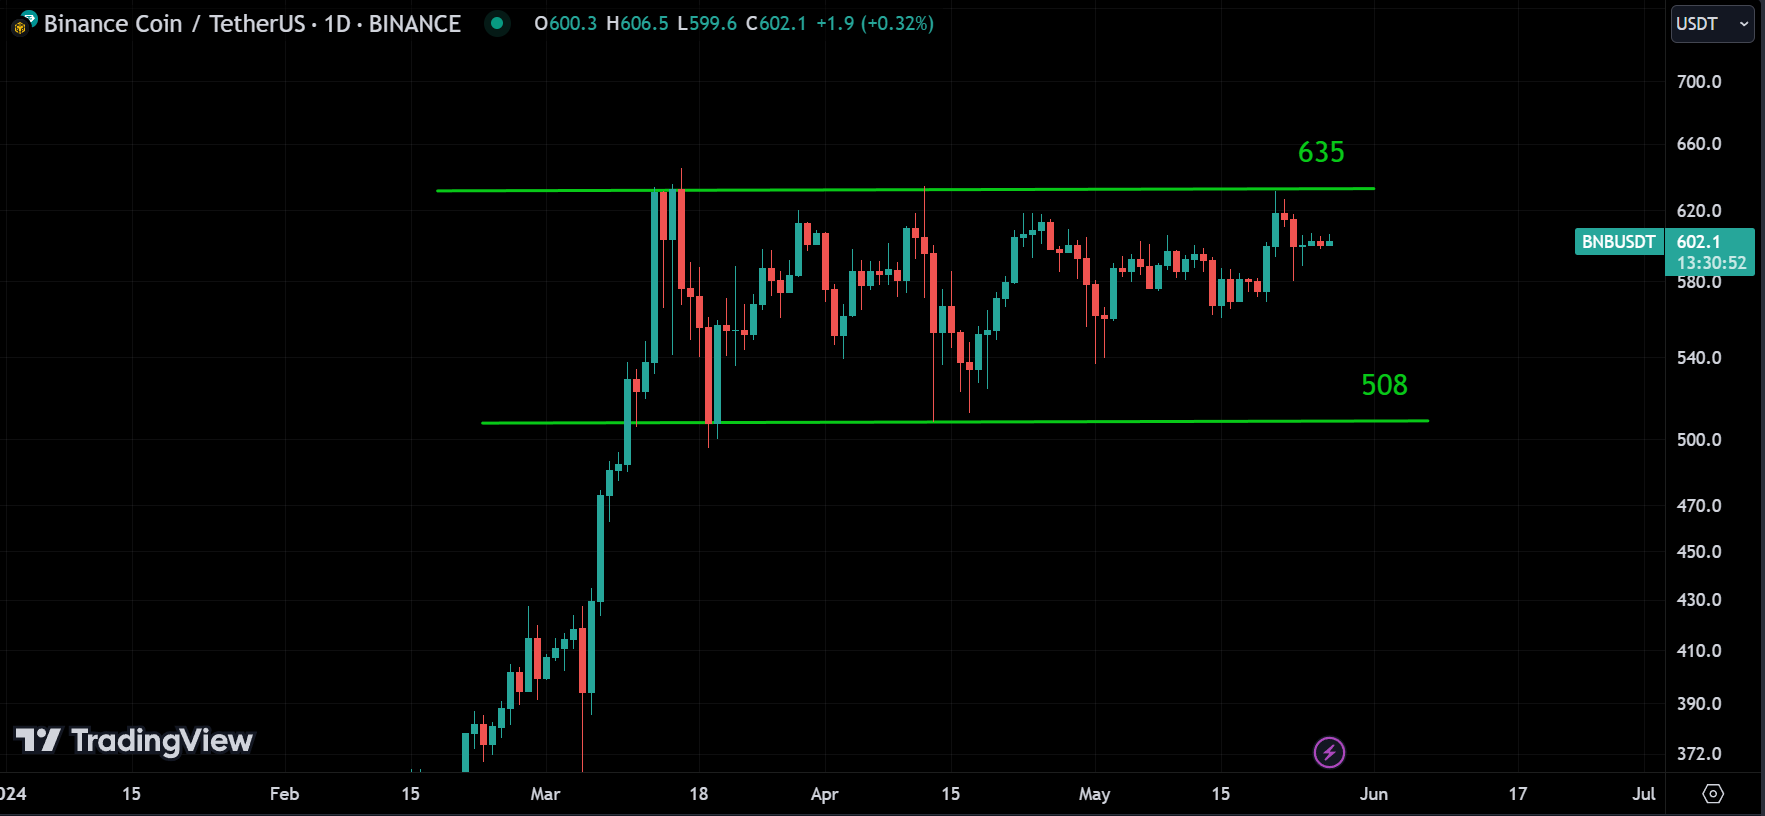
BNB is clearly on a sideways trend, and it’s currently trading around its resistance level. It even touched that level and retraced. What we can expect now is either the price breaking this level and continuing to rise, or it retracing from the 635 level.
There’s no stock market or commodity coverage for today, as ETFs don’t trade. We’ll have them tomorrow.
Disclaimer
The information provided in this market analysis is for educational and informational purposes only. It should not be construed as financial advice or a recommendation to buy, sell, or hold any securities or investments.
All investments involve risk, and past performance is not indicative of future results. The analysis provided may not be suitable for all investors and should be used at their own discretion.
These analyses are here to help you understand how to analyze the market. They’re not about giving buy or sell signals. It’s simply about observing market behavior. I don’t recommend when to buy or sell because trading doesn’t work that way. You need a strategy to guide your decisions about when to enter or exit positions. That’s the key to making consistent profits in the financial markets over time.
I discussed these sectors and markets because when the entire market or sector goes through certain movements, most of the stocks within that market will also experience similar movements. So, by understanding what the market is doing, you can conduct your own analysis on specific coins or stocks.
Readers are encouraged to conduct their own research.
Trading and investing in financial markets carry inherent risks, including the risk of losing invested capital. It is important to carefully consider your investment objectives, risk tolerance, and financial situation before making any investment decisions.
GOOD LUCK!!!