
![Stock Market Analysis Today [2024.05.31]: Wrapping up May.
xlearnonline.com](https://xlearnonline.com/wp-content/uploads/2024/05/Green-Professional-Finance-YouTube-Thumbnail-1.png)
Hi, it’s time for Stock Market Analysis Today. It’s the last day of May, so as we wrap up May, let’s see what the market has to tell us.
Key Trading Events Today
These events encompass important global news, macroeconomic reports, and economic indicators. For more details, you can check the Bloomberg Calendar.
We’re expecting the PCE Index and Chicago PMI to come out today. Besides these two, there aren’t any major events that could strongly impact the market.
Stocks with Earnings:
S&P 500
![SP500 Analysis Today [2024.05.31]:
xlearnonline.com](https://xlearnonline.com/wp-content/uploads/2024/05/SPY-1D.png)
![SP500 Analysis Today [2024.05.31]:
xlearnonline.com](https://xlearnonline.com/wp-content/uploads/2024/05/SPY-1H.png)
Checking out SPY, it’s hitting new highs and is on an uptrend. The strongest support for the price is around 495. Looking at the one-hour chart, the price reached a resistance level around 532 but failed to break it, falling back to the support level. If today the price breaks below this support level, we can anticipate SPY dropping even further to the next support around 510. Conversely, the price might start climbing from this 520 level back to the high of 532.
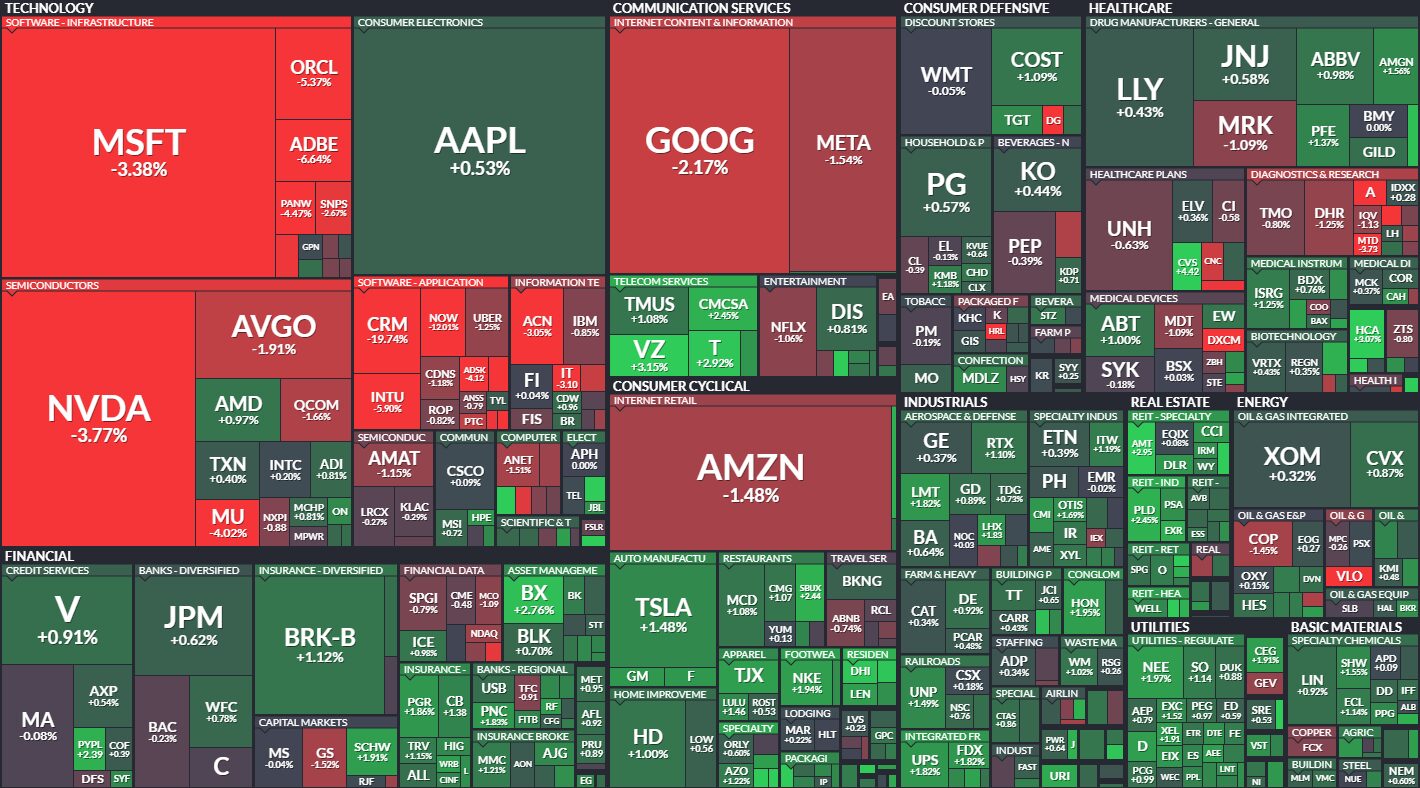
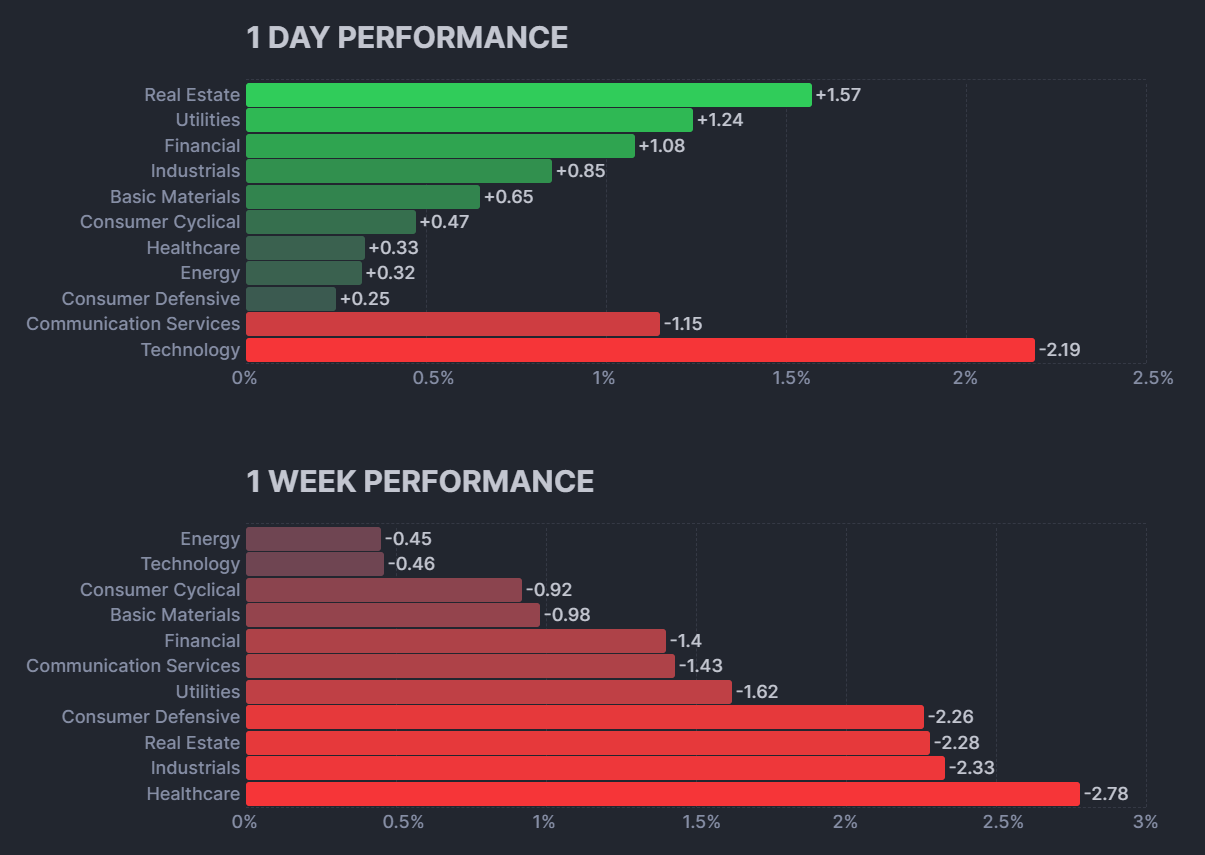
Yesterday, the overall market saw gains, but the technology sector faced some losses. Microsoft was down 3.38%, Nvidia dropped 3.77%, and both Google and Meta also experienced declines. However, other sectors seemed to be performing well. Let’s take a closer look at the day’s performance for a clearer picture.
Consumer Staples Sector:
![XLP Analysis Today [2024.05.31]:
xlearnonline.com](https://xlearnonline.com/wp-content/uploads/2024/05/XLP-1D.png)
![XLP Analysis Today [2024.05.31]:
xlearnonline.com](https://xlearnonline.com/wp-content/uploads/2024/05/XLP-H.png)
XLP appears to be generally on an uptrend, but in the medium term, it’s undergoing a correction. If you examine the one-hour chart, you’ll notice that it’s trading around a certain level of support. We can anticipate the price reversing from this level to begin an upward movement. However, if the price breaks below this level, we might see it declining further towards the next support level.
Energy Sector:
![XLE Analysis Today [2024.05.31]:
xlearnonline.com](https://xlearnonline.com/wp-content/uploads/2024/05/XLE-D.png)
![XLE Analysis Today [2024.05.31]:
xlearnonline.com](https://xlearnonline.com/wp-content/uploads/2024/05/XLE-H.png)
XLE has started to trend downwards, with the price breaking below the support level and currently trading beneath it. Immediately after the breakout, it retraced back to touch the line. What we can anticipate today is that the price may start dropping from that level. However, if the price manages to re-enter the triangle area, it might signal a change in the trend for the energy sector. Nevertheless, overall, the trend remains bearish for the energy sector.
Materials Sector:
![XLB Analysis Today [2024.05.31]:
xlearnonline.com](https://xlearnonline.com/wp-content/uploads/2024/05/XLB-D.png)
![XLB Analysis Today [2024.05.31]:
xlearnonline.com](https://xlearnonline.com/wp-content/uploads/2024/05/XLB-H.png)
XLB seems to be trending downwards, with the strongest support for the price around 87. If you examine the one-hour chart, you’ll notice that the price is currently trading around the 90 level, where there is both support and resistance. From this setup, if the price breaks above the resistance level, we can anticipate it to rise. However, if the price breaks below the resistance level, we can expect it to drop towards the 87 level.
Industrial Sector:
![XLI Analysis Today [2024.05.31]:
xlearnonline.com](https://xlearnonline.com/wp-content/uploads/2024/05/XLI-D.png)
![XLI Analysis Today [2024.05.31]:
xlearnonline.com](https://xlearnonline.com/wp-content/uploads/2024/05/XLI-H.png)
The Industrial sector appears to be in a sideways trend, nearing its strongest support level. What we can anticipate is that the price may rebound from this support around 120 to begin moving back up. However, on the other hand, if the price manages to break below this level, we can expect it to drop further down.
Consumer Discretionary Sector:
![XLY Analysis Today [2024.05.31]:
xlearnonline.com](https://xlearnonline.com/wp-content/uploads/2024/05/XLY-D.png)
![XLY Analysis Today [2024.05.31]:
xlearnonline.com](https://xlearnonline.com/wp-content/uploads/2024/05/XLY-H.png)
XLY appears to be in a sideways trend, with the strongest support for the price around 170. Observing the one-hour chart, it’s trading near a support level, where there is also a resistance. From this setup, if the price breaks below, it may drop further; if it breaks above, it may start to ascend. Alternatively, it may consolidate within these levels.
Healthcare Sector:
![XLV Analysis Today [2024.05.31]:
xlearnonline.com](https://xlearnonline.com/wp-content/uploads/2024/05/XLV-D.png)
![XLV Analysis Today [2024.05.31]:
xlearnonline.com](https://xlearnonline.com/wp-content/uploads/2024/05/XLV-H.png)
XLV is also experiencing a sideways trend, with the strongest support around 139. Examining the one-hour chart, it’s still uncertain whether the price has returned above the line. However, what we do know for sure is that 139 is the strongest support. Therefore, if the price begins to drop from its current trading position, it should find support around 139. Alternatively, it could start moving upwards, but it’s more likely to drop to the 139 level.
Financials Sector:
![XLF Analysis Today [2024.05.31]:
xlearnonline.com](https://xlearnonline.com/wp-content/uploads/2024/05/XLF-D.png)
![XLF Analysis Today [2024.05.31]:
xlearnonline.com](https://xlearnonline.com/wp-content/uploads/2024/05/XLF-H.png)
After experiencing an upward momentum, the financial sector began to decline, breaking below the support level and trading below it. This indicates a potential change in trend for XLF. What we can anticipate is that the price could rise back up to touch the line and then resume dropping, or it could re-enter the trend by breaking the level again. However, overall, there is a higher likelihood of it dropping.
Technology Sector:
![XLK Analysis Today [2024.05.31]:
xlearnonline.com](https://xlearnonline.com/wp-content/uploads/2024/05/XLK-D.png)
![XLK Analysis Today [2024.05.31]:
xlearnonline.com](https://xlearnonline.com/wp-content/uploads/2024/05/XLK-H.png)
XLK experienced a gap down after reaching a high, breaking below the support level and trading even lower. We can anticipate further dropping to around the 204 level. This may indicate a correction phase, so it’s worth noting. However, if the price returns back up to the 212 level, it suggests that the uptrend is still intact.
Communications Sector:
![XLC Analysis Today [2024.05.31]:
xlearnonline.com](https://xlearnonline.com/wp-content/uploads/2024/05/XLC-D.png)
![XLC Analysis Today [2024.05.31]:
xlearnonline.com](https://xlearnonline.com/wp-content/uploads/2024/05/XLC-H.png)
XLC is currently trading near its highest level, with a support around 81.50. If the price breaks below this level, we can expect it to drop to the next support. Conversely, if the price continues to rise and breaks the resistance around 83.50, XLC will likely keep moving upwards.
Utility Sector:
![XLU Analysis Today [2024.05.31]:
xlearnonline.com](https://xlearnonline.com/wp-content/uploads/2024/05/XLU-D.png)
![XLU Analysis Today [2024.05.31]:
xlearnonline.com](https://xlearnonline.com/wp-content/uploads/2024/05/XLU-H.png)
XLU is currently on an uptrend, but it recently underwent a correction after reaching a high. Now, it’s showing signs of moving back up. On the one-hour chart, there’s a resistance level around 72. If the price breaks above this level, we can anticipate XLU to continue its upward movement. However, there’s also a possibility that it could retrace from the 72 level and start dropping further.
Real Estate Sector:
![XLRE Analysis Today [2024.05.31]:
xlearnonline.com](https://xlearnonline.com/wp-content/uploads/2024/05/XLRE-D.png)
![XLRE Analysis Today [2024.05.31]:
xlearnonline.com](https://xlearnonline.com/wp-content/uploads/2024/05/XLRE-H.png)
Examining XLRE, we find the strongest support for the price around 35.75, while it’s currently trading near a resistance level of 37.50. If the price breaks above the 37.50 range, we can anticipate it to continue rising for a while. Alternatively, it could drop from its current trading position to the 35.75 level.
You might be wondering why we’re discussing sectors in a stock market analysis article. Well, when trading certain stocks, understanding their sector’s performance is crucial. If a sector experiences a downturn, all stocks within it are likely to be affected similarly. Therefore, knowing how each sector is performing allows you to tailor your trading strategy. By avoiding stocks in struggling sectors and opting for those in stronger sectors, you can potentially save a significant amount of money.
I’m looking to add more to this article, so feel free to share your thoughts. What do you think about the article, and what could be better? Your ideas are welcome!
Disclaimer
The information provided in this market analysis is for educational and informational purposes only. It should not be construed as financial advice or a recommendation to buy, sell, or hold any securities or investments.
All investments involve risk, and past performance is not indicative of future results. The analysis provided may not be suitable for all investors and should be used at their own discretion.
These analyses are here to help you understand how to analyze the market. They’re not about giving buy or sell signals. It’s simply about observing market behavior. I don’t recommend when to buy or sell because trading doesn’t work that way. You need a strategy to guide your decisions about when to enter or exit positions. That’s the key to making consistent profits in the financial markets over time.
I discussed these sectors and markets because when the entire market or sector goes through certain movements, most of the stocks within that market will also experience similar movements. So, by understanding what the market is doing, you can conduct your own analysis on specific coins or stocks.
Readers are encouraged to conduct their own research.
Trading and investing in financial markets carry inherent risks, including the risk of losing invested capital. It is important to carefully consider your investment objectives, risk tolerance, and financial situation before making any investment decisions.
GOOD LUCK!!!