
![Stock Market Analysis Today[2024.06.03]
xlearnonline.com](https://xlearnonline.com/wp-content/uploads/2024/06/Stock-Market-Analysis.png)
Welcome to Stock Market Analysis Today! It’s June 3rd, 2024, and we’re diving into the first trading day and week of the month to uncover the latest insights and trends shaping the stock market landscape. Let’s delve into some charts and analyze the movements driving the market’s pulse.
Key Trading Events Today
These events encompass important global news, macroeconomic reports, and economic indicators. For more details, you can check the Bloomberg Calendar.
We have the ISM Manufacturing PMI around 10.00 AM with a forecast of 49.8, compared to the previous 49.2. Apart from this, there are no other concerning events for today.
Stocks with Earnings:
S&P 500
![SP 500 Stock Market Analysis Today[2024.06.03]
xlearnonline.com](https://xlearnonline.com/wp-content/uploads/2024/06/SPY-D.png)
![sp500 Stock Market Analysis Today[2024.06.03]
xlearnonline.com](https://xlearnonline.com/wp-content/uploads/2024/06/SPY-H.png)
Examining SPY, it’s back on the move, with a significant surge in trading volume. Anticipate either a breakthrough of the all-time high today or a period of consolidation before a correction. Nevertheless, the overall trend for the S&P 500 remains bullish.
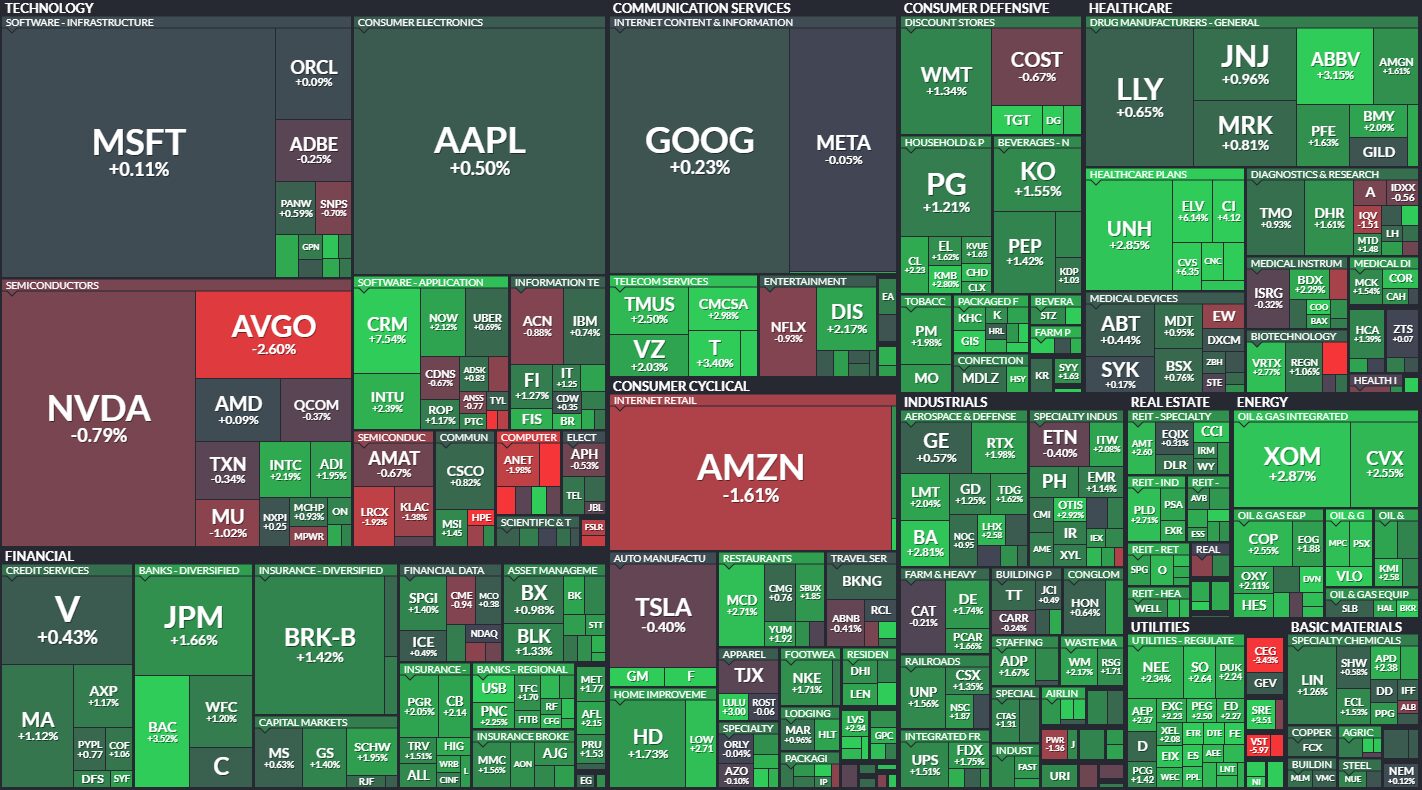
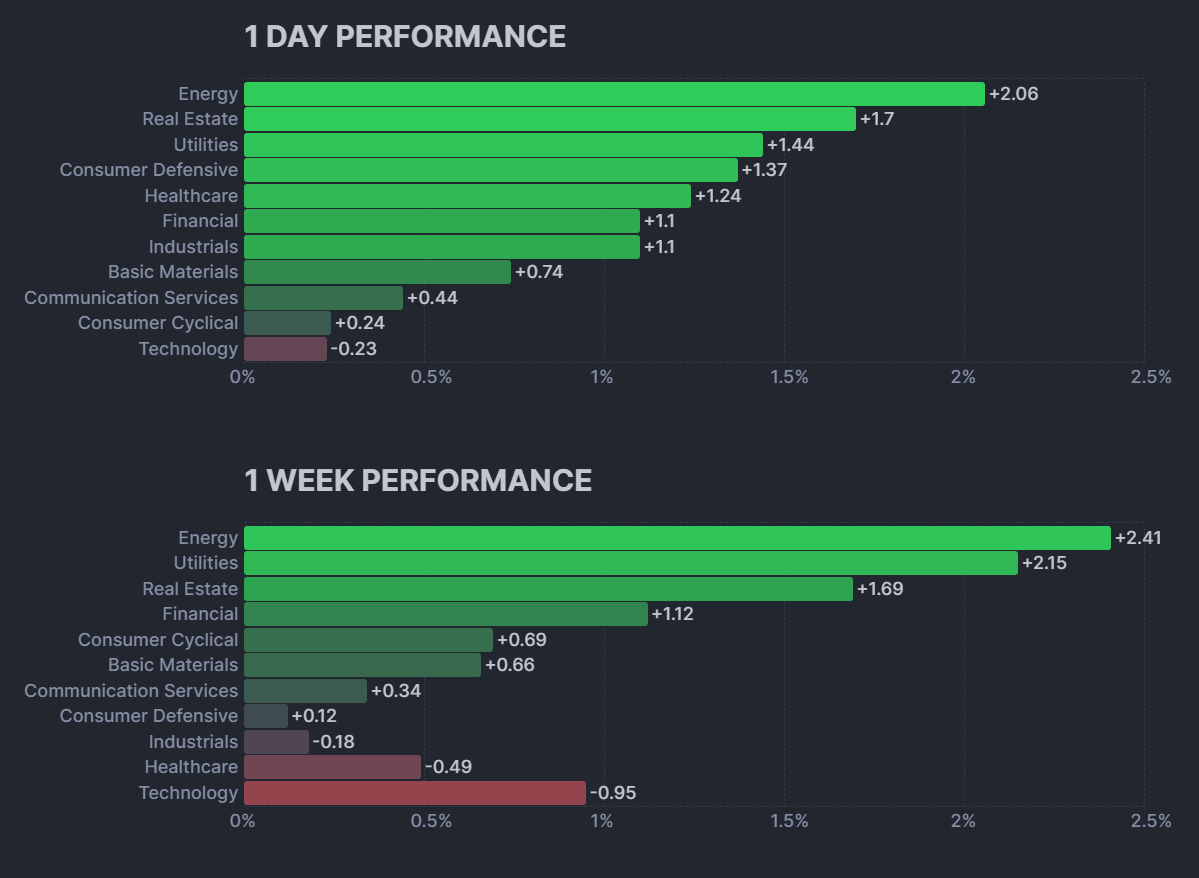
Overall, the market did well except for the technology sector, everything else is looking positive. Today is the start of a new month and the first trading day of the week. Some psychological factors might influence today’s trading. Now, let’s check out how each sector is performing to decide on today’s overall market direction. If you’re trading individual stocks, it’s wise to consider their sector as well.
Consumer Staples Sector:
![XLP Stock Market Analysis Today[2024.06.03]
xlearnonline.com](https://xlearnonline.com/wp-content/uploads/2024/06/XLP.png)
![XLP Stock Market Analysis Today[2024.06.03]
xlearnonline.com](https://xlearnonline.com/wp-content/uploads/2024/06/XLP-H.png)
Checking out the consumer staples sector, it’s on an upward trend. The price is trading close to a resistance level. If the price breaks above this level today, we can expect it to keep going up towards the upper trend line. There’s also a chance it might pull back to the 76 support level. If that level is also broken, then it could drop to the lower support line.
Energy Sector:
![XLE Stock Market Analysis Today[2024.06.03]
xlearnonline.com](https://xlearnonline.com/wp-content/uploads/2024/06/XLE-D.png)
![XLE Stock Market Analysis Today[2024.06.03]
xlearnonline.com](https://xlearnonline.com/wp-content/uploads/2024/06/XLE-H.png)
The energy sector seems to be heading downward, which is evident from a one-hour chart. The main point from this analysis is that currently, the price is trading close to a resistance level. It’s unlikely to break above this level, but there’s still a chance. If it does break through, it could mark the start of a new uptrend. Alternatively, the price might retreat from that level to around the support at 91. If that level is also broken, it could drop to 87.
Materials Sector:
![XLB Stock Market Analysis Today[2024.06.03]
xlearnonline.com](https://xlearnonline.com/wp-content/uploads/2024/06/XLB.png)
![XLB Stock Market Analysis Today[2024.06.03]
xlearnonline.com](https://xlearnonline.com/wp-content/uploads/2024/06/XLB-H.png)
The materials sector seems to be moving sideways for now, but there’s an upward trend in the medium term. If you check the one-hour chart, you’ll notice the price is hovering around a resistance level. It could either keep rising and break through that resistance, or it might pull back from there. Given the sideways trend, a pullback is more likely.
Industrial Sector:
![XLI Stock Market Analysis Today[2024.06.03]
xlearnonline.com](https://xlearnonline.com/wp-content/uploads/2024/06/XLI-D.png)
![XLI Stock Market Analysis Today[2024.06.03]
xlearnonline.com](https://xlearnonline.com/wp-content/uploads/2024/06/XLI-H.png)
The industrials sector is also in a sideways trend, and it’s bouncing back from its strongest support level. Currently, it’s near a resistance level, and what we can anticipate from this is that if the price breaks above this level today, it might continue to rise towards the next resistance around 126. However, the price could also pull back from the 123.50 level to 120.50.
120 is the strongest support and 126 is the strongest resistance for the price. If either of these levels is broken, that will indicate the direction in which the price is heading next.
Consumer Discretionary Sector:
![XLY Stock Market Analysis Today[2024.06.03]
xlearnonline.com](https://xlearnonline.com/wp-content/uploads/2024/06/XLY-D.png)
![XLY Stock Market Analysis Today[2024.06.03]
xlearnonline.com](https://xlearnonline.com/wp-content/uploads/2024/06/XLY-H.png)
The consumer discretionary sector is also moving sideways. If you check the one-hour chart, you’ll notice a support around 174 and a resistance around 176. If the price breaks above the resistance level, we can expect it to reach the 180 level. On the other hand, if the price breaks below the 174 level, it might drop to 170. It’s best to wait for a breakout to confirm the trend.
Healthcare Sector:
![XLV Stock Market Analysis Today[2024.06.03]
xlearnonline.com](https://xlearnonline.com/wp-content/uploads/2024/06/XLV.png)
![XLV Stock Market Analysis Today[2024.06.03]
xlearnonline.com](https://xlearnonline.com/wp-content/uploads/2024/06/XLV-H.png)
The healthcare sector is also stuck in a sideways trend, with 138 and 148 serving as the strongest support and resistance levels for the price. If you glance at the one-hour chart, you’ll notice a support around 141, and the price seems to be bouncing back from this level. What we can expect today is for the price to either continue climbing and reach 147, or pull back below 141. So, the key level to watch is 141. As long as the price stays above that range, it’s likely going up. Also, bear in mind that if the price hits 148, there’s a higher chance it might retrace from that level.
Financials Sector:
![XLF Stock Market Analysis Today[2024.06.03]
xlearnonline.com](https://xlearnonline.com/wp-content/uploads/2024/06/XLF-D.png)
![XLF Stock Market Analysis Today[2024.06.03]
xlearnonline.com](https://xlearnonline.com/wp-content/uploads/2024/06/XLF-H.png)
Looking at the financial sector, it’s in an uptrend. The strongest resistance is at 42.50, and the lower trend line supports the price. On the one-hour chart, the price closed right at a resistance level. Today, the price might break above this resistance and head towards 42.50, or it could pull back from 41.60 to the lower trend line. Remember, a breakout could happen on either side, and that breakout will confirm the trend, so watch closely for breakouts.
Technology Sector:
![XLK Stock Market Analysis Today[2024.06.03]
xlearnonline.com](https://xlearnonline.com/wp-content/uploads/2024/06/XLK.png)
![XLK Stock Market Analysis Today[2024.06.03]
xlearnonline.com](https://xlearnonline.com/wp-content/uploads/2024/06/XLK-H.png)
Looking at the technology sector, after hitting a high of 220, the price suddenly dropped to 206 but is now starting to climb back up. This quick drop was just a correction. We can expect the price to keep rising if it breaks the resistance levels shown on the charts. Also, remember that the 204 level is a strong support for the price.
Communications Sector:
![XLC Stock Market Analysis Today[2024.06.03]
xlearnonline.com](https://xlearnonline.com/wp-content/uploads/2024/06/XLC-H.png)
![XLC Stock Market Analysis Today[2024.06.03]
xlearnonline.com](https://xlearnonline.com/wp-content/uploads/2024/06/XLC.png)
The communications sector is also trading near a resistance level of 83.60, with strong support around 82. What we can expect today is that the price will either break above this resistance level and continue rising, or it will pull back from this level to 82.
Utility Sector:
![XLU Stock Market Analysis Today[2024.06.03]
xlearnonline.com](https://xlearnonline.com/wp-content/uploads/2024/06/XLU.png)
![XLU Stock Market Analysis Today[2024.06.03]
xlearnonline.com](https://xlearnonline.com/wp-content/uploads/2024/06/XLU-H.png)
The utilities sector is hovering near its strongest resistance level around 73. What we can anticipate today is that the price might either retreat from that level to 72 or break through the 73 resistance and keep climbing. So, it’s best to wait for breakout signals or signs of a reversal.
Real Estate Sector:
![XLRE Stock Market Analysis Today[2024.06.03]
xlearnonline.com](https://xlearnonline.com/wp-content/uploads/2024/06/XLRE-D.png)
![XLRE Stock Market Analysis Today[2024.06.03]
xlearnonline.com](https://xlearnonline.com/wp-content/uploads/2024/06/XLRE-H.png)
Looking at the real estate sector, the long-term trend is sideways, but there’s an uptrend in the medium term. It could face resistance around 38.50, and if the price breaks above this level and 39, we can expect it to reach 40.50.
Disclaimer
The information provided in this market analysis is for educational and informational purposes only. It should not be construed as financial advice or a recommendation to buy, sell, or hold any securities or investments.
All investments involve risk, and past performance is not indicative of future results. The analysis provided may not be suitable for all investors and should be used at their own discretion.
These analyses are here to help you understand how to analyze the market. They’re not about giving buy or sell signals. It’s simply about observing market behavior. I don’t recommend when to buy or sell because trading doesn’t work that way. You need a strategy to guide your decisions about when to enter or exit positions. That’s the key to making consistent profits in the financial markets over time.
I discussed these sectors and markets because when the entire market or sector goes through certain movements, most of the stocks within that market will also experience similar movements. So, by understanding what the market is doing, you can conduct your own analysis on specific coins or stocks.
Readers are encouraged to conduct their own research.
Trading and investing in financial markets carry inherent risks, including the risk of losing invested capital. It is important to carefully consider your investment objectives, risk tolerance, and financial situation before making any investment decisions.
GOOD LUCK!!!