
![Stock Market Analysis Today [2024.06.04]: The Energy Sector is at a Critical Stage.
xlearnonline.com](https://xlearnonline.com/wp-content/uploads/2024/06/Stock-Market-Analysis-2.png)
Hi there! Welcome to Stock Market Analysis Today, It’s Tuesday morning, June 4th, 2024. Let’s brighten the day by looking at some charts!
Key Trading Events Today
These events encompass important global news, macroeconomic reports, and economic indicators. For more details, you can check the Bloomberg Calendar.
This morning, around 10:00 AM, we’ll get the JOLTs Job Openings report. The forecast is 8.370 million, compared to the previous 8.488 million. Besides this, there are no other major events today.
Stocks with Earnings:
S&P 500
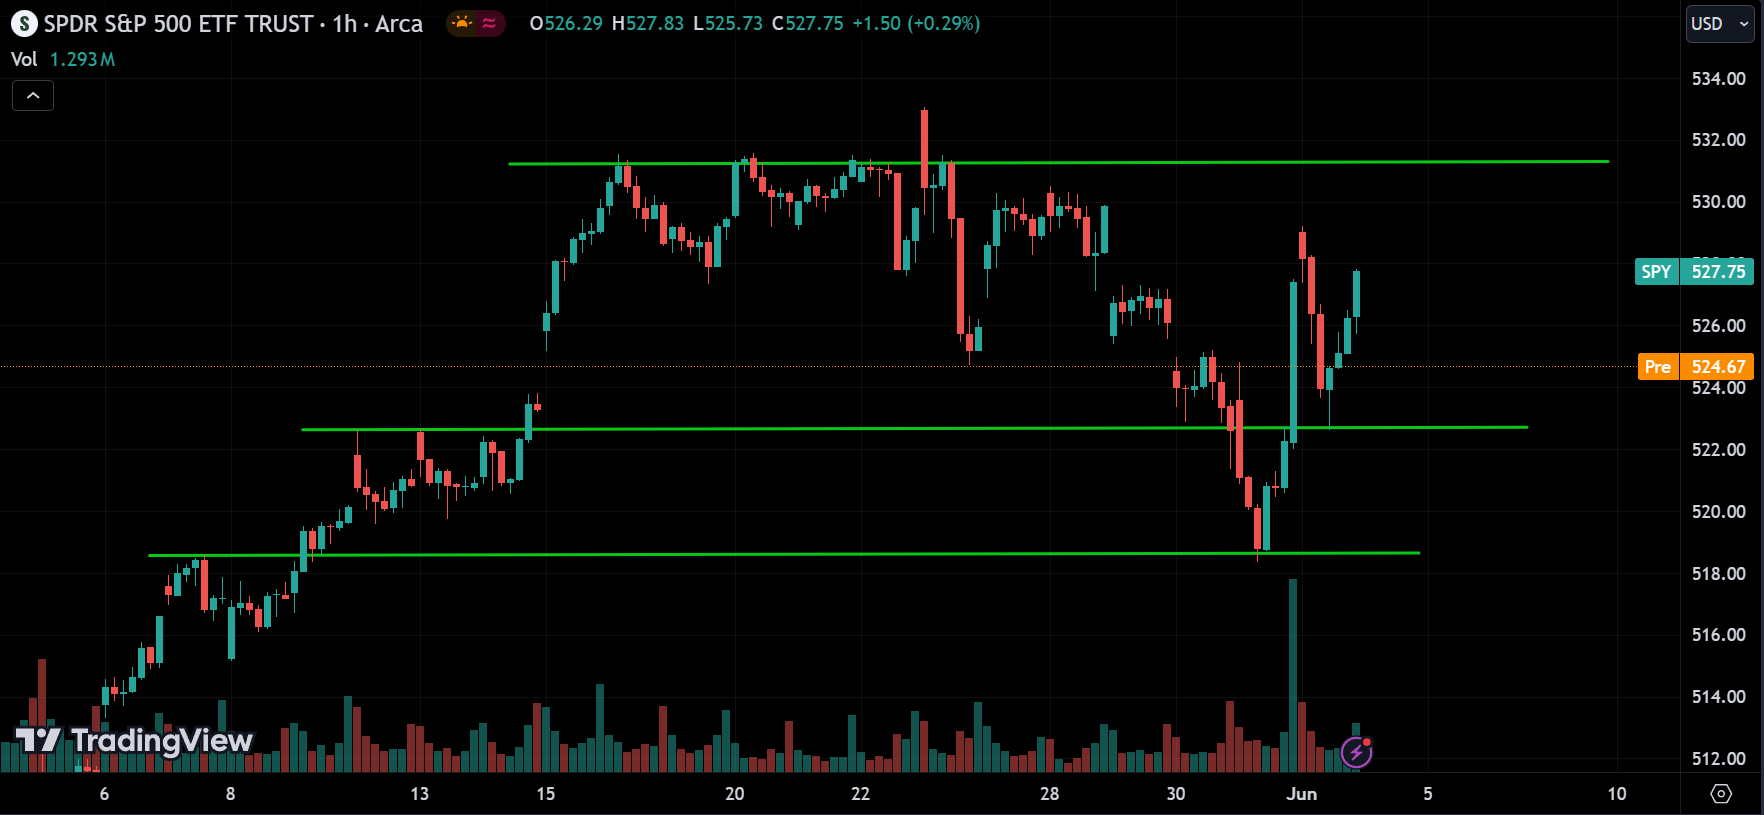
The S&P 500 is on an upward trend and is moving towards its all-time high, as we discussed yesterday. The 532 level is a strong resistance point for the price. The price might pull back from there, or it could break through and reach new highs. Overall, the trend for SPY is bullish.
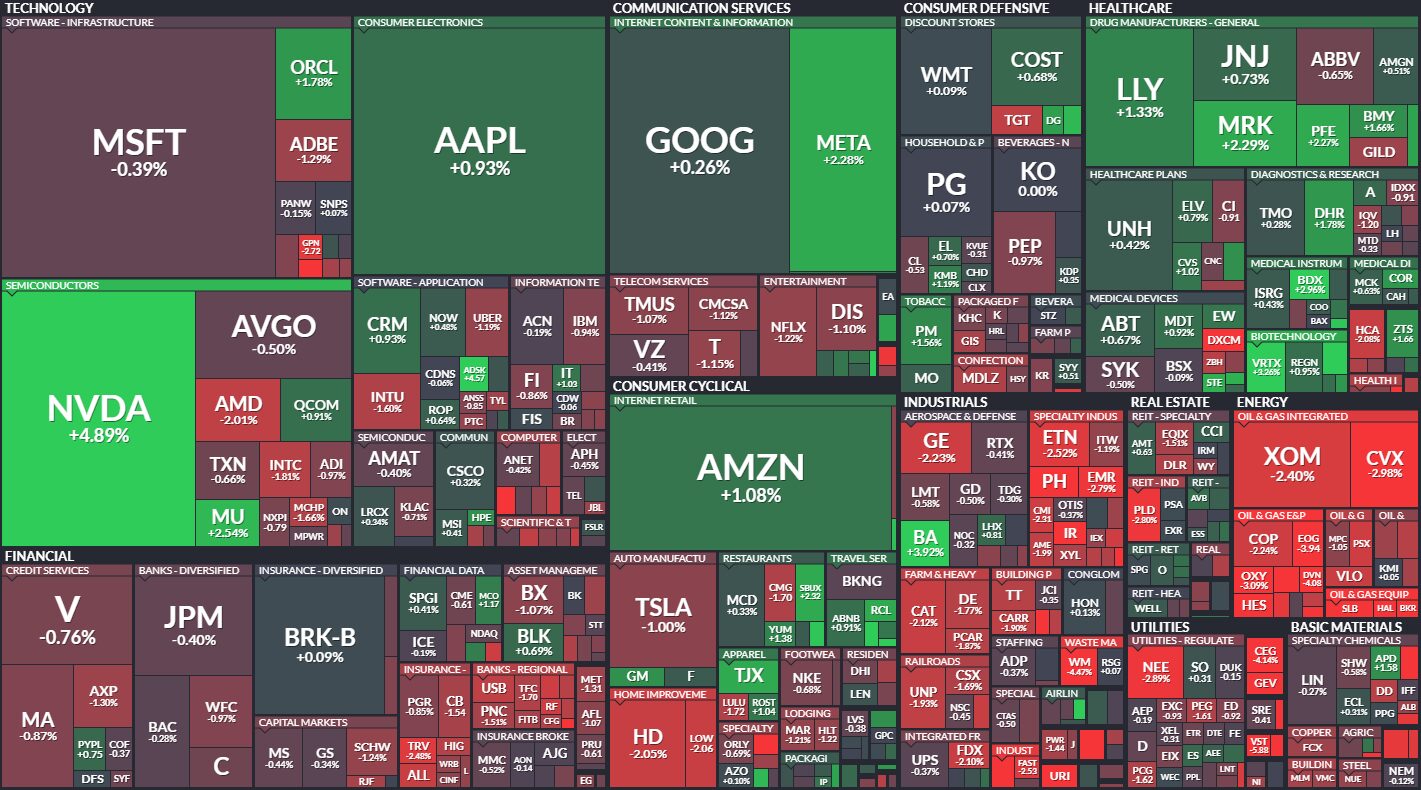
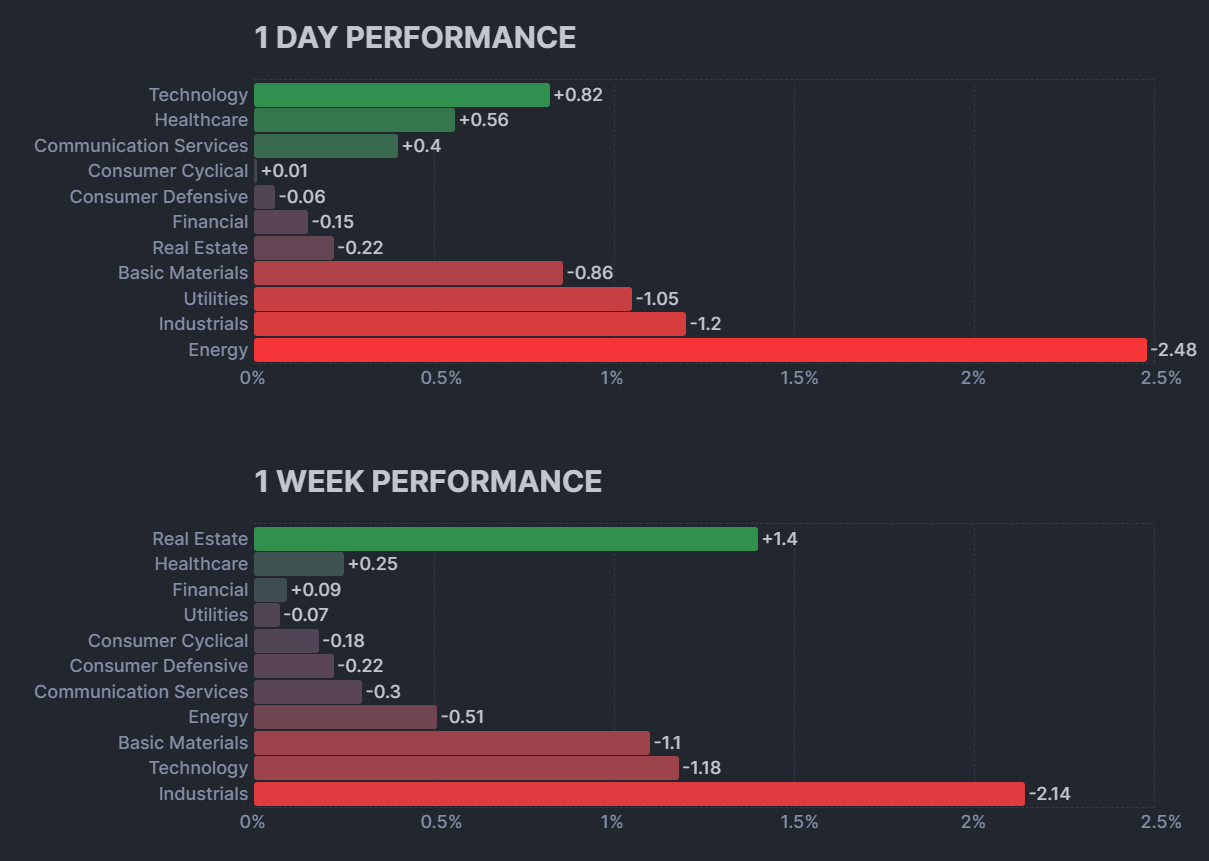
It looks like the healthcare sector did well, with NVDA up 4.89%. and energy sector crashed a bit. Overall, the market was average yesterday, neither very good nor very bad. Let’s check out the performance of each sector.
Consumer Staples Sector:
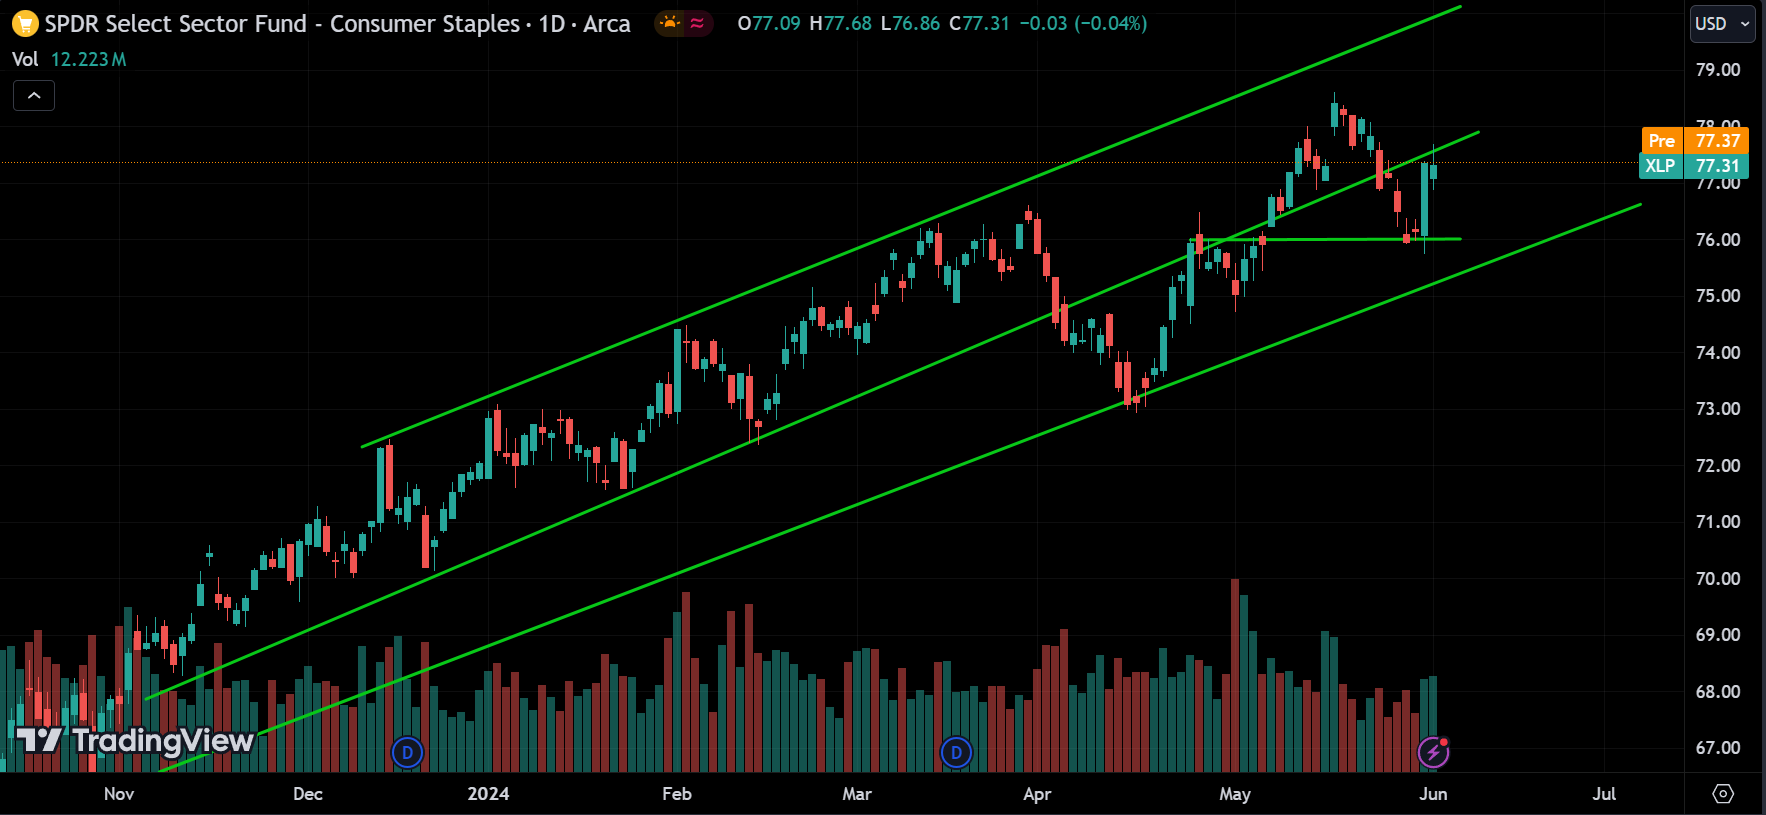
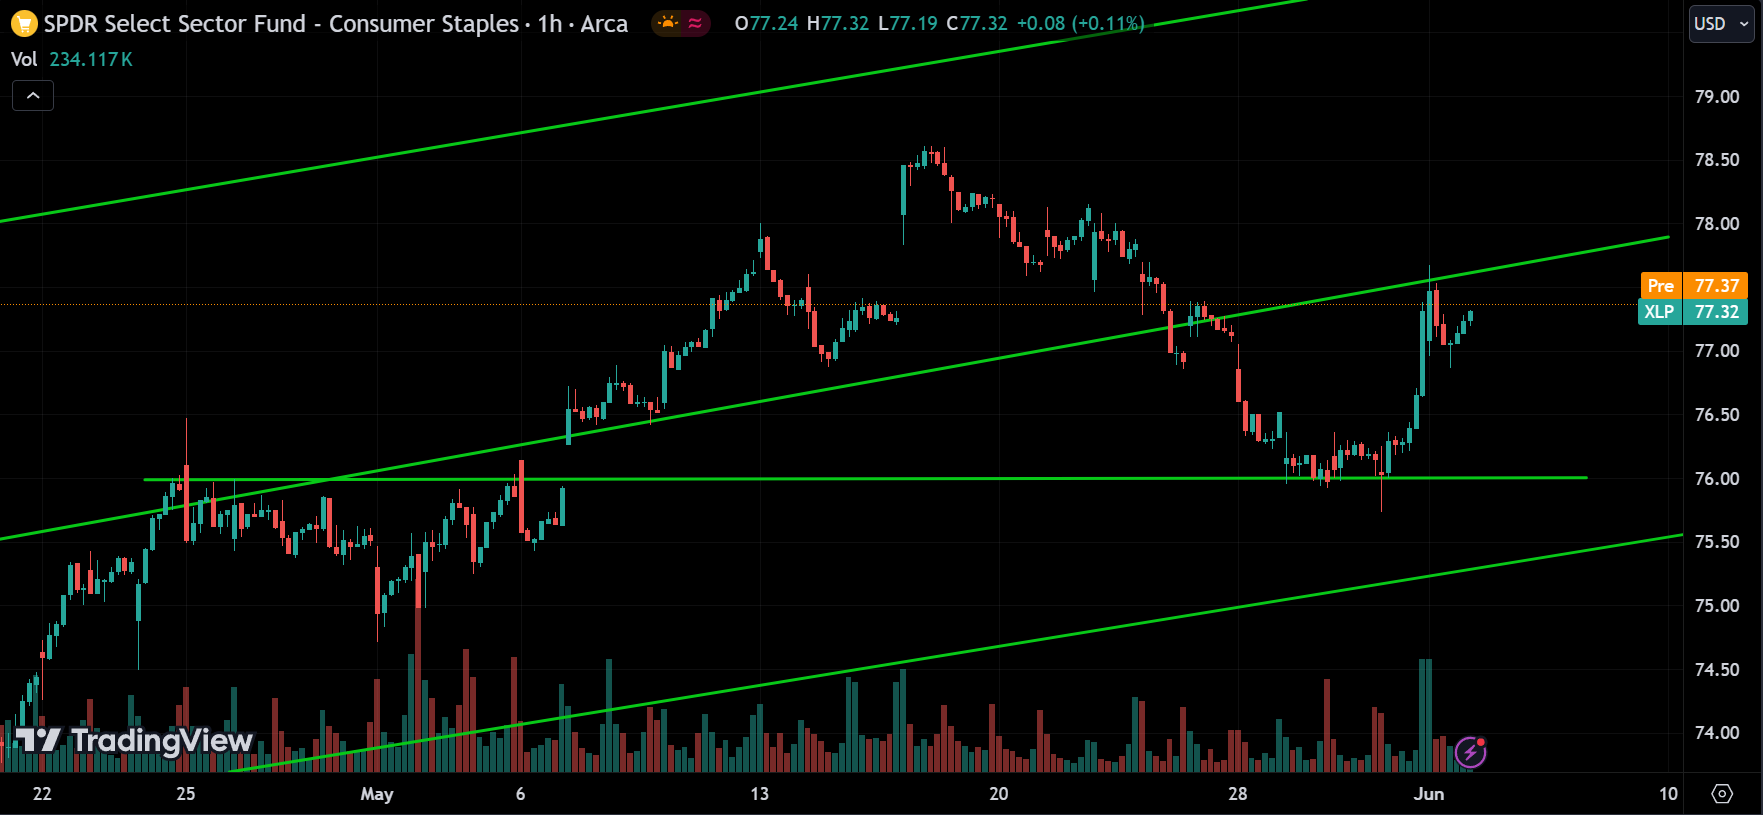
In the consumer staples sector, the overall trend is still upward. Right now, the price is at a resistance level. The 76 level seems to be good support. We might see the price break above this resistance and continue rising, or it could pull back to the 76 range. Keep an eye out for potential breakouts.
Energy Sector:
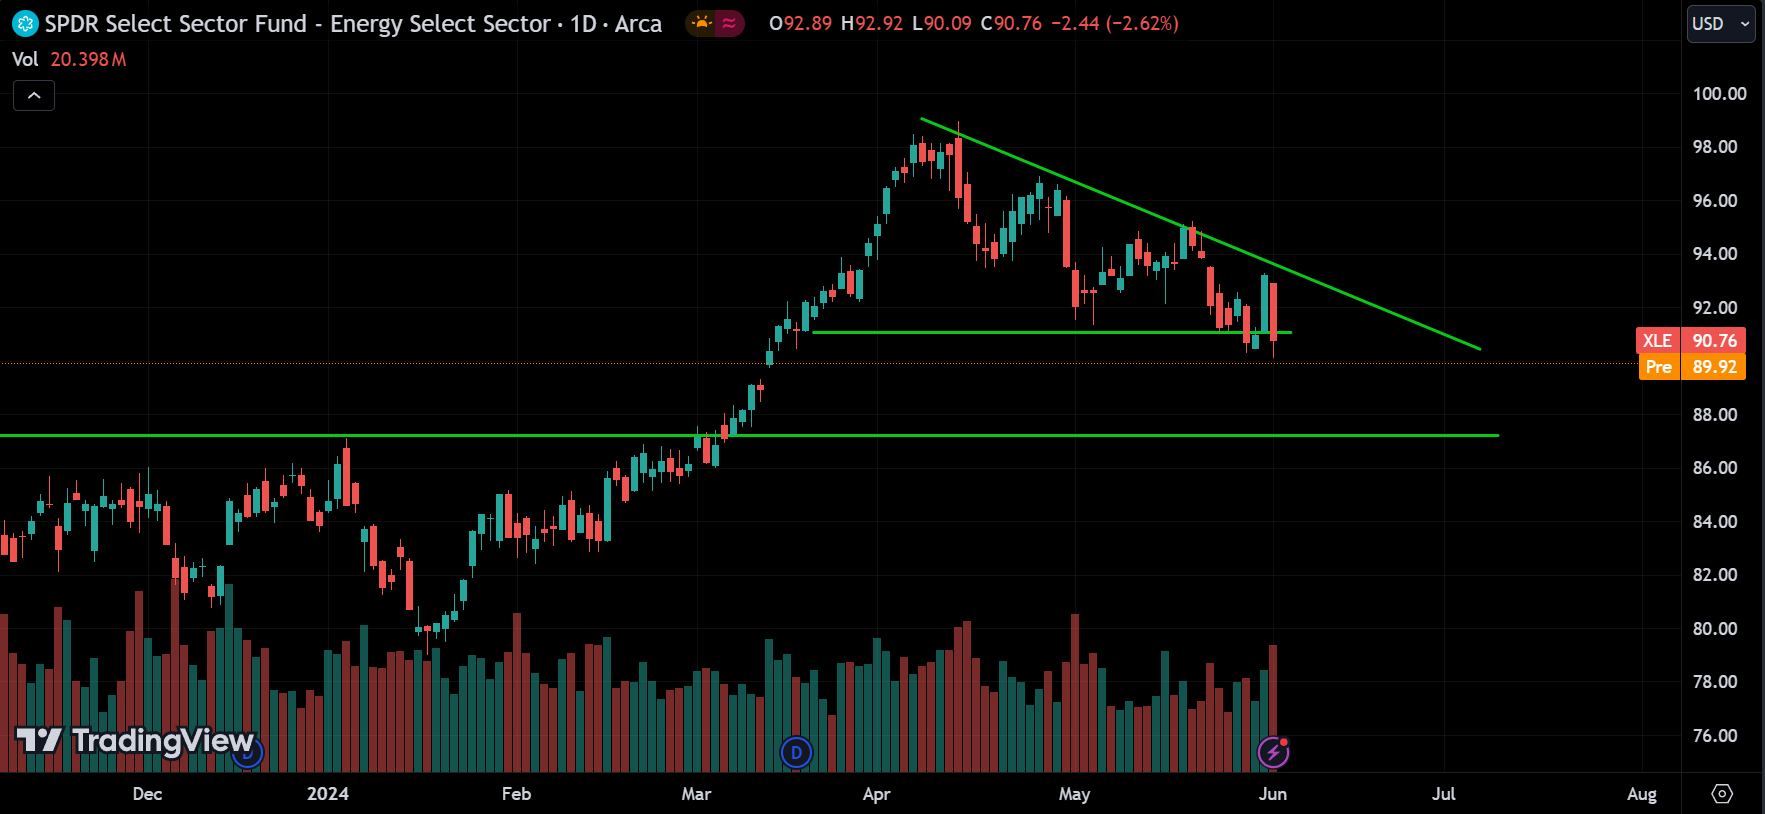
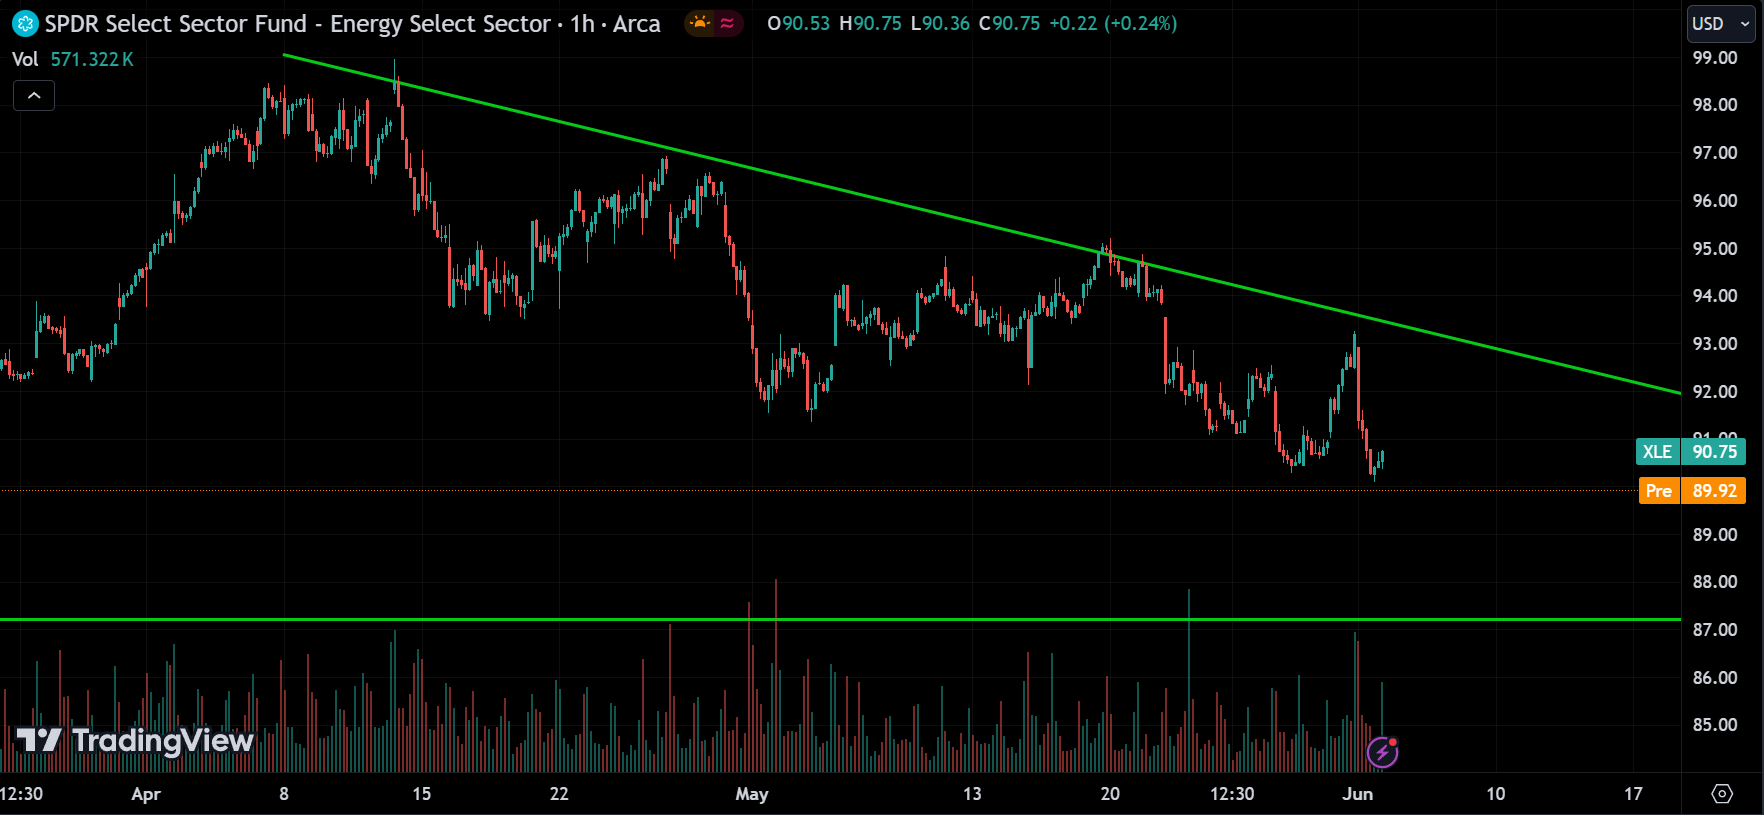
The energy sector is on a downtrend, and we can expect it to keep falling today. There might be some small corrections, but overall, the trend is downward. The 1-hour chart shows the trend line pointing down. As long as the price stays below this line, the energy sector is in a bearish phase.
Materials Sector:
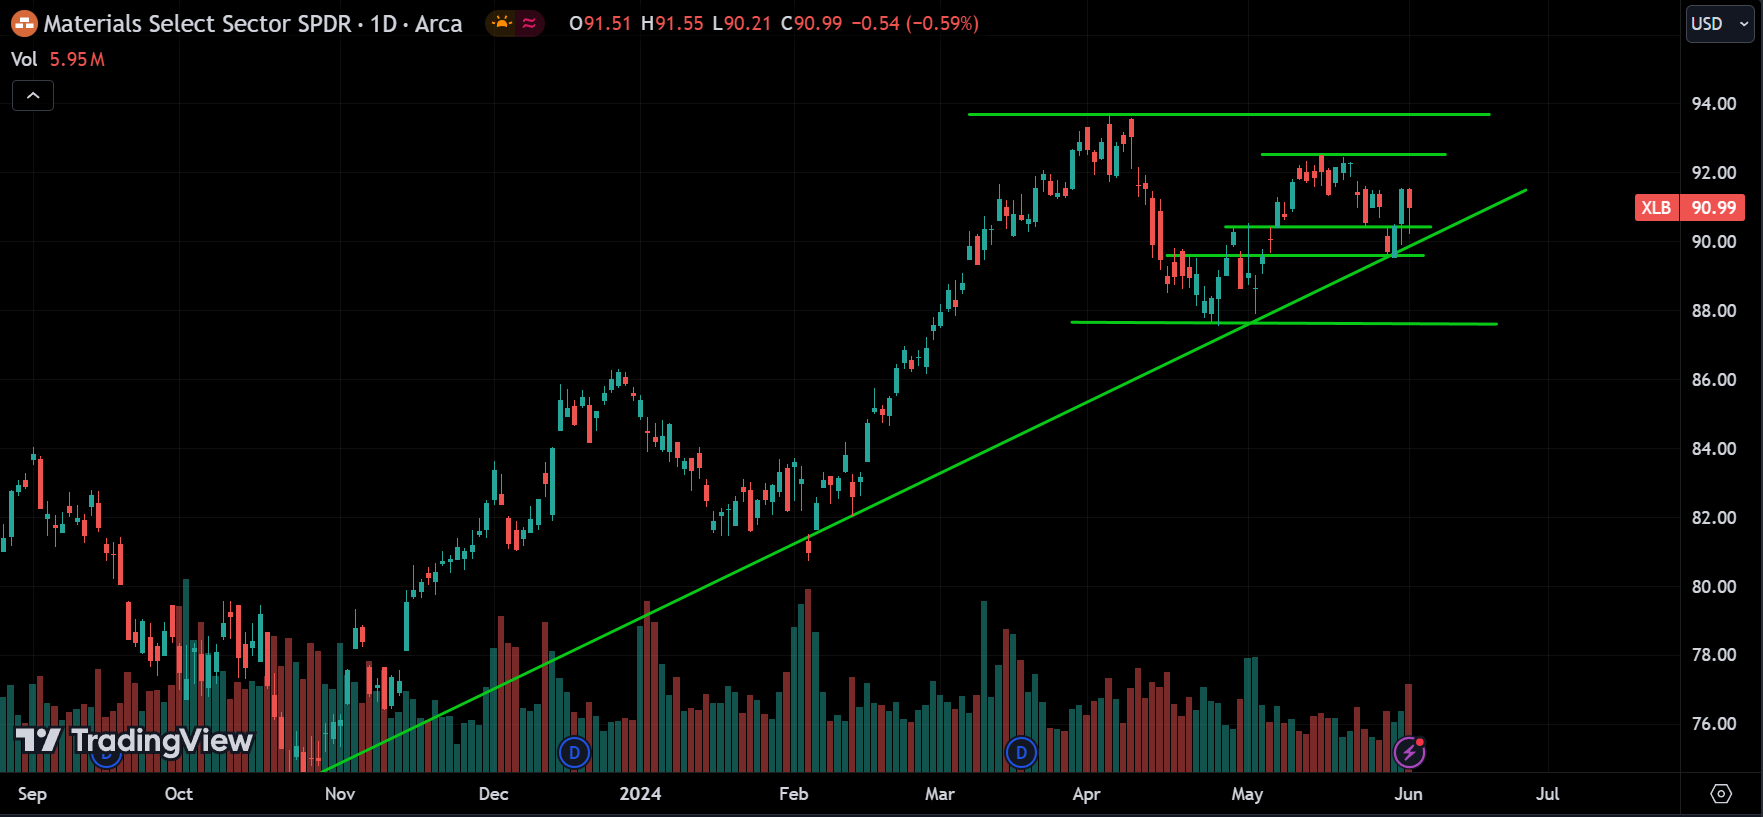
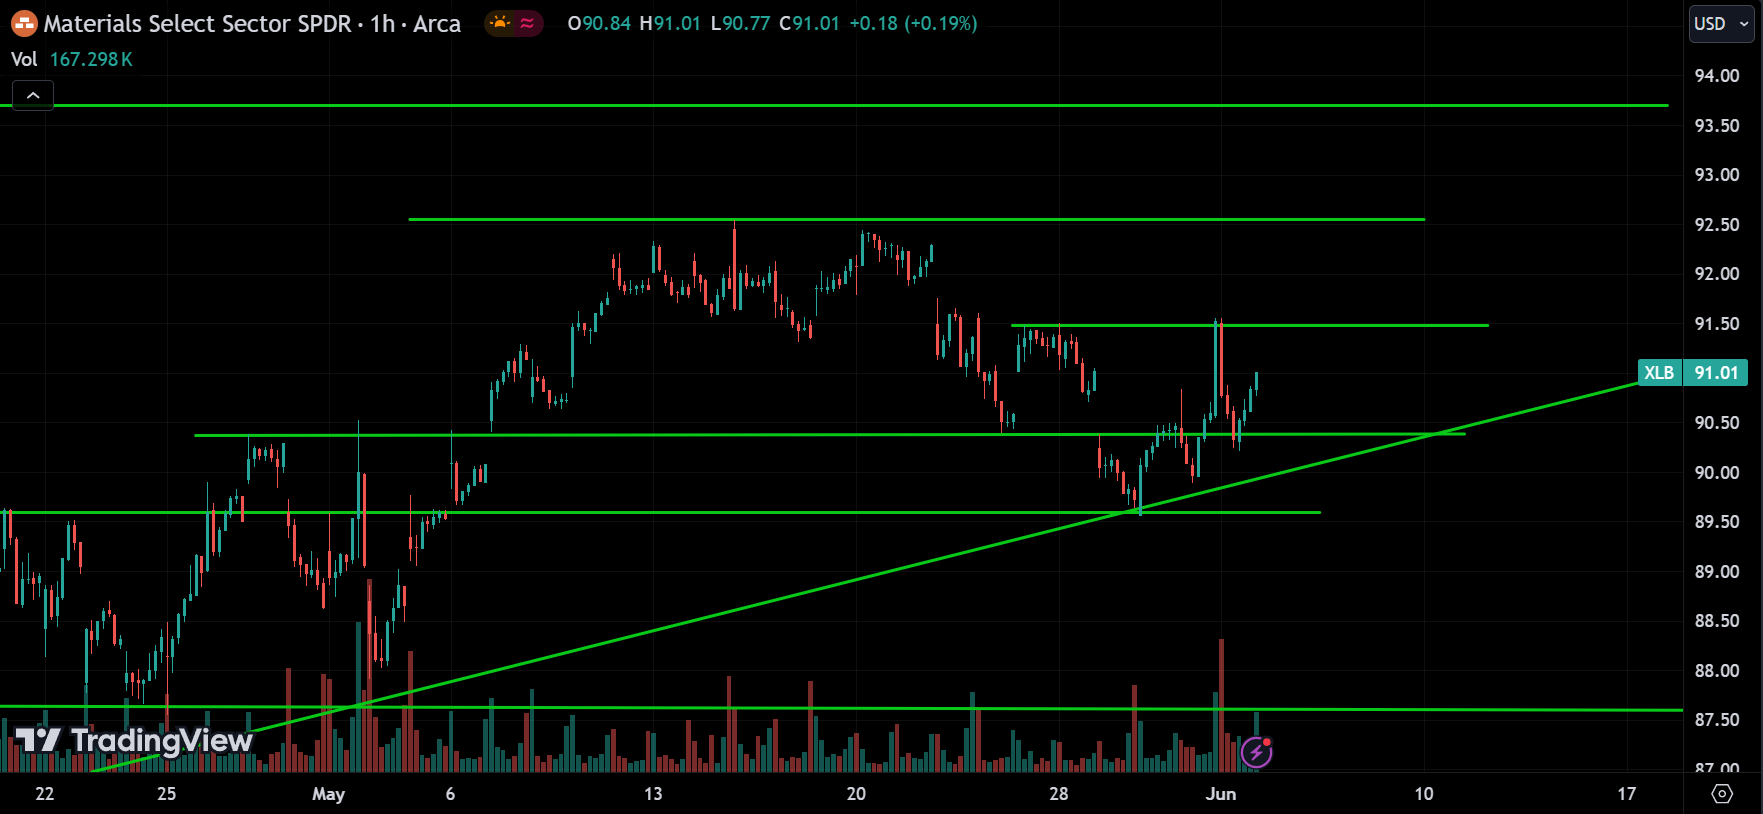
The materials sector is on an uptrend. On the 1-hour chart, you can see that after reaching a resistance level around 91.50, the price dropped but is now heading back to that level. We can expect either the price to break through the 91.50 level and continue rising or, like last time, to pull back from that level again.
Industrial Sector:
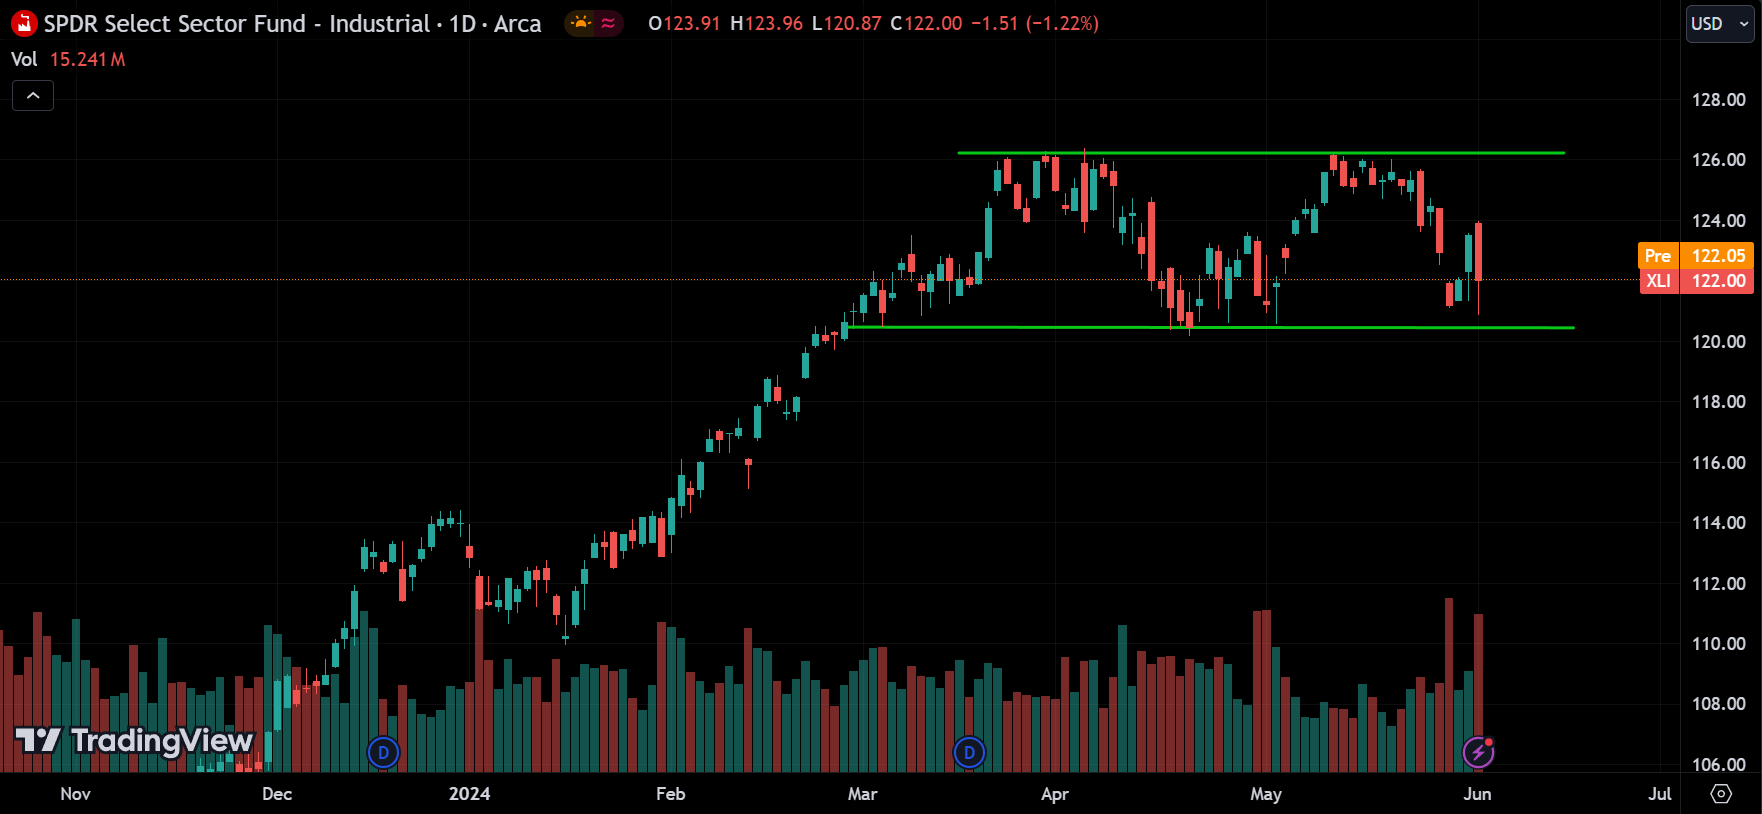
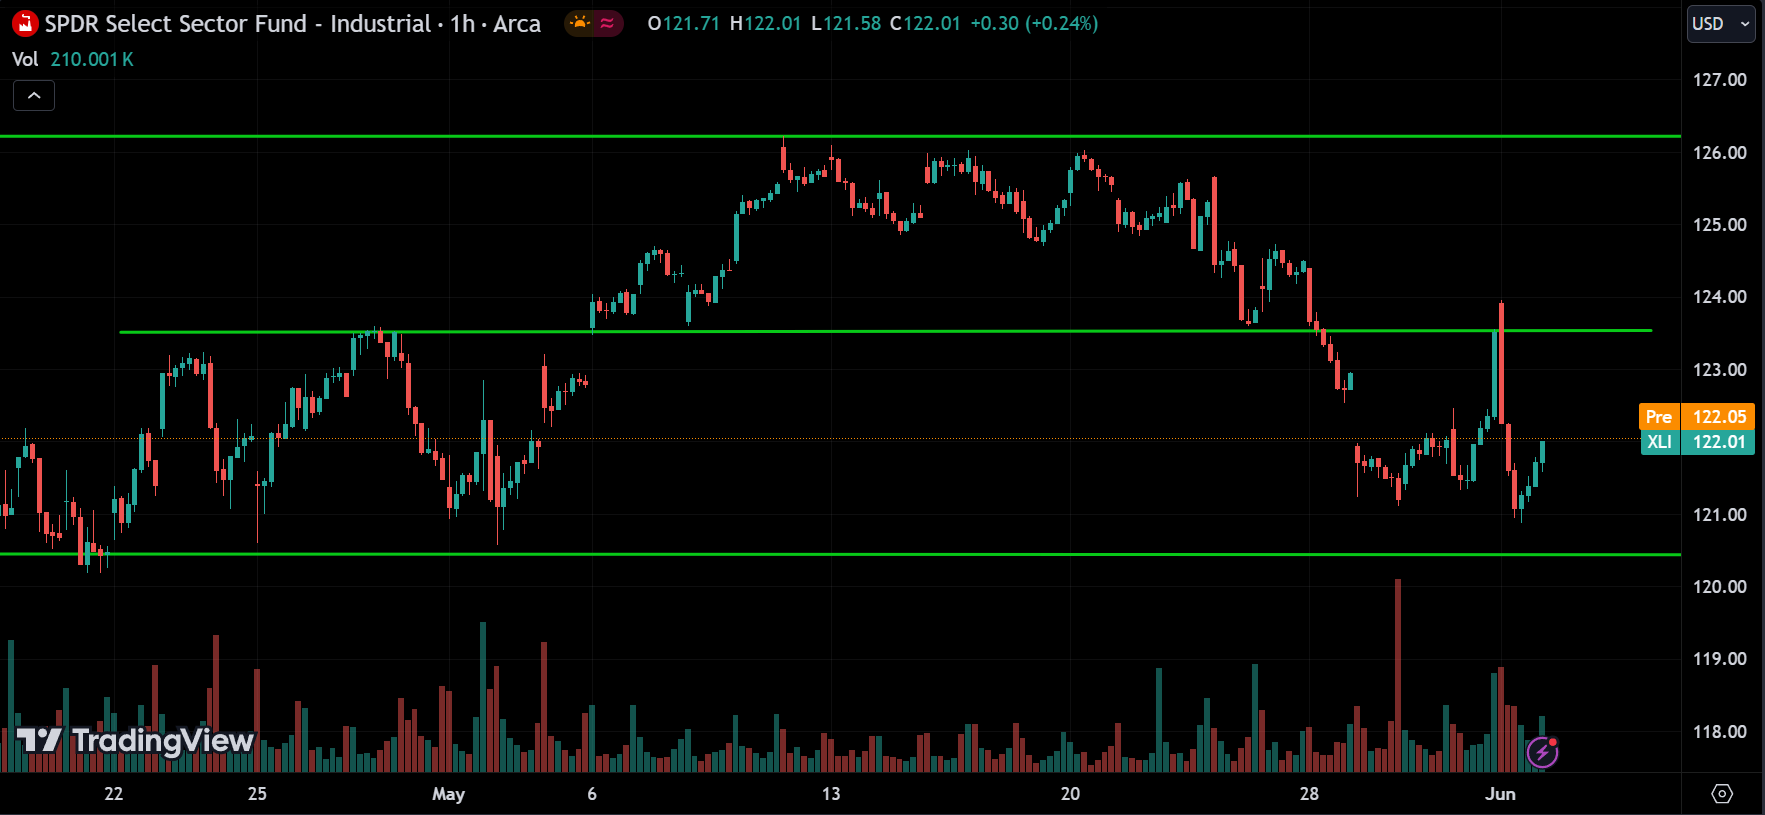
The industrial sector is moving sideways. The price has good support at 120 and resistance at 126. On the 1-hour chart, the price hit a low around 121 and is starting to go back up. The 124 range is a resistance level. If the price breaks above 124, it might keep rising, or it could pull back from that level. Keep in mind that if the price breaks below 120 or above 126, the trend could change.
Consumer Discretionary Sector:
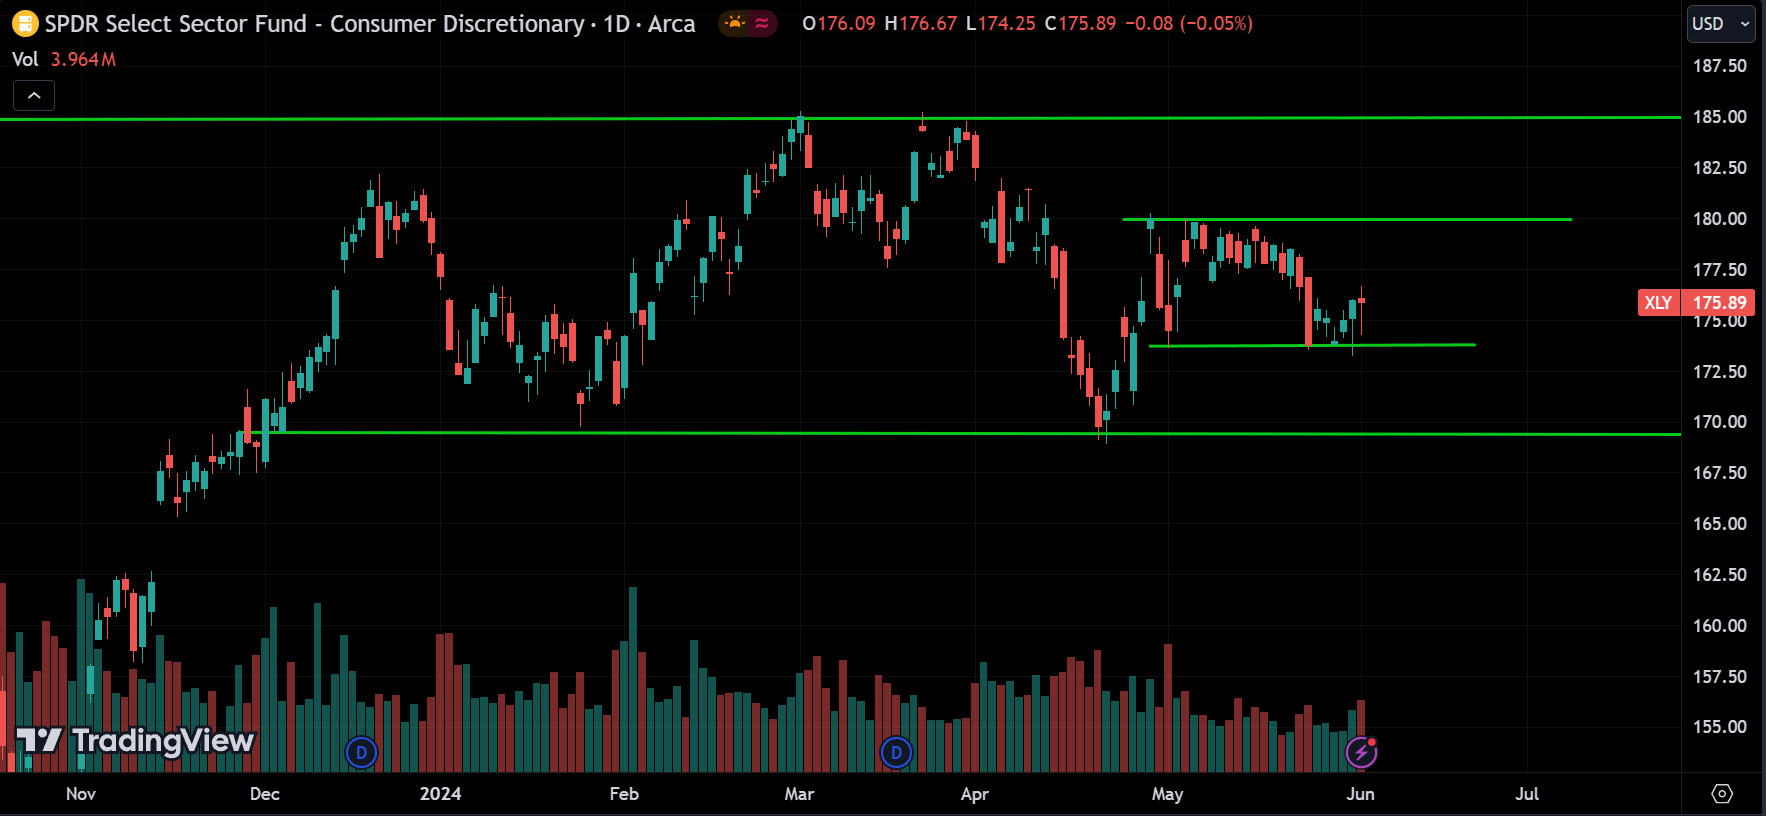
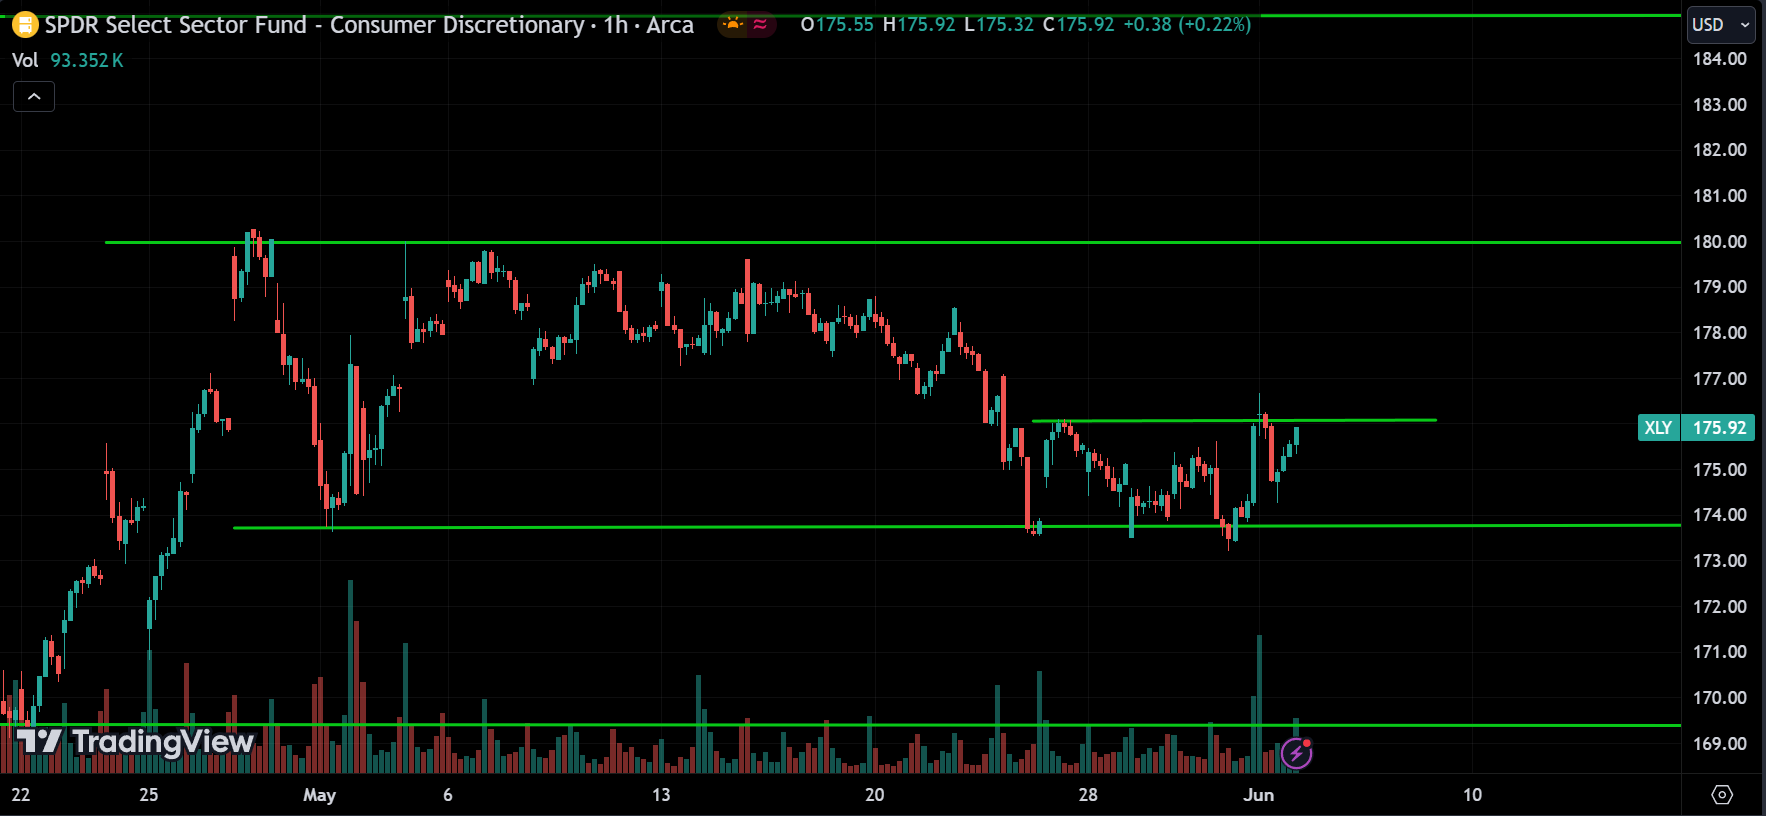
Looking at the consumer discretionary sector, it is also moving sideways. The 170 and 185 levels are good support and resistance. On the 1-hour chart, the 174 range is strong support, as the price hasn’t been able to break below it four times. Now, it’s trading around the 176 resistance level. If the price breaks above 176, it might go up to 185. If it breaks below 174, it could drop to 170. It might also stay between these levels for a while. So, there are three possibilities.
Healthcare Sector:
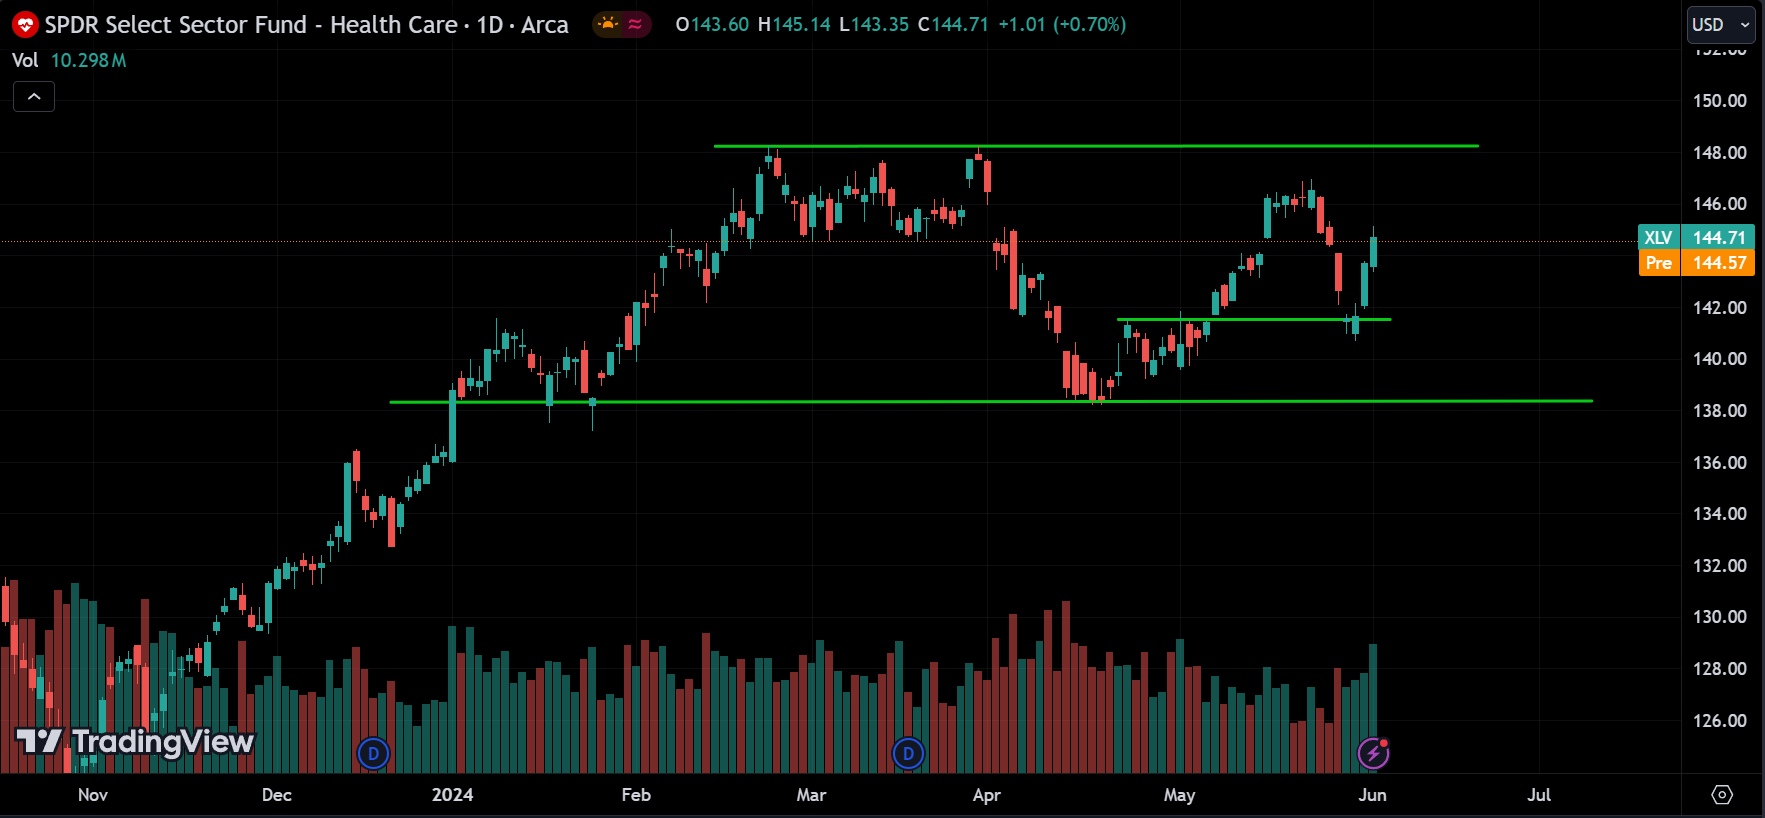
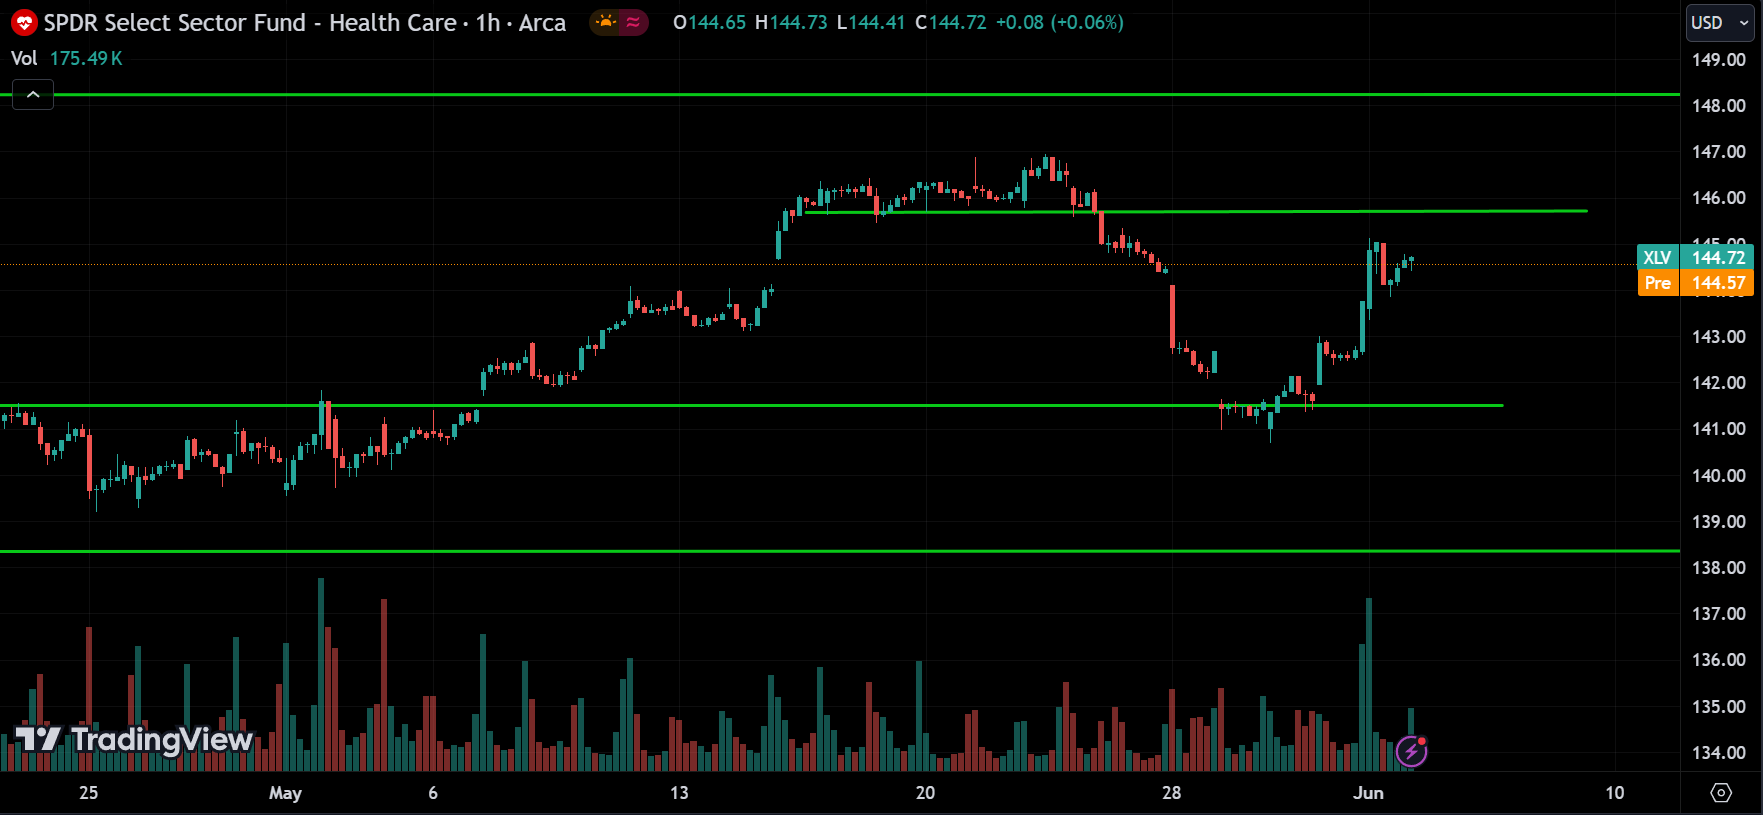
Looking at the healthcare sector, it’s also moving sideways. The 138 and 148 levels are strong resistance points. A breakout at these levels would signal a trend change. On the 1-hour chart, the price is heading towards 146, which is a resistance level. The price might pull back from there, or it could break through and go up. So, wait for confirmation.
Financials Sector:
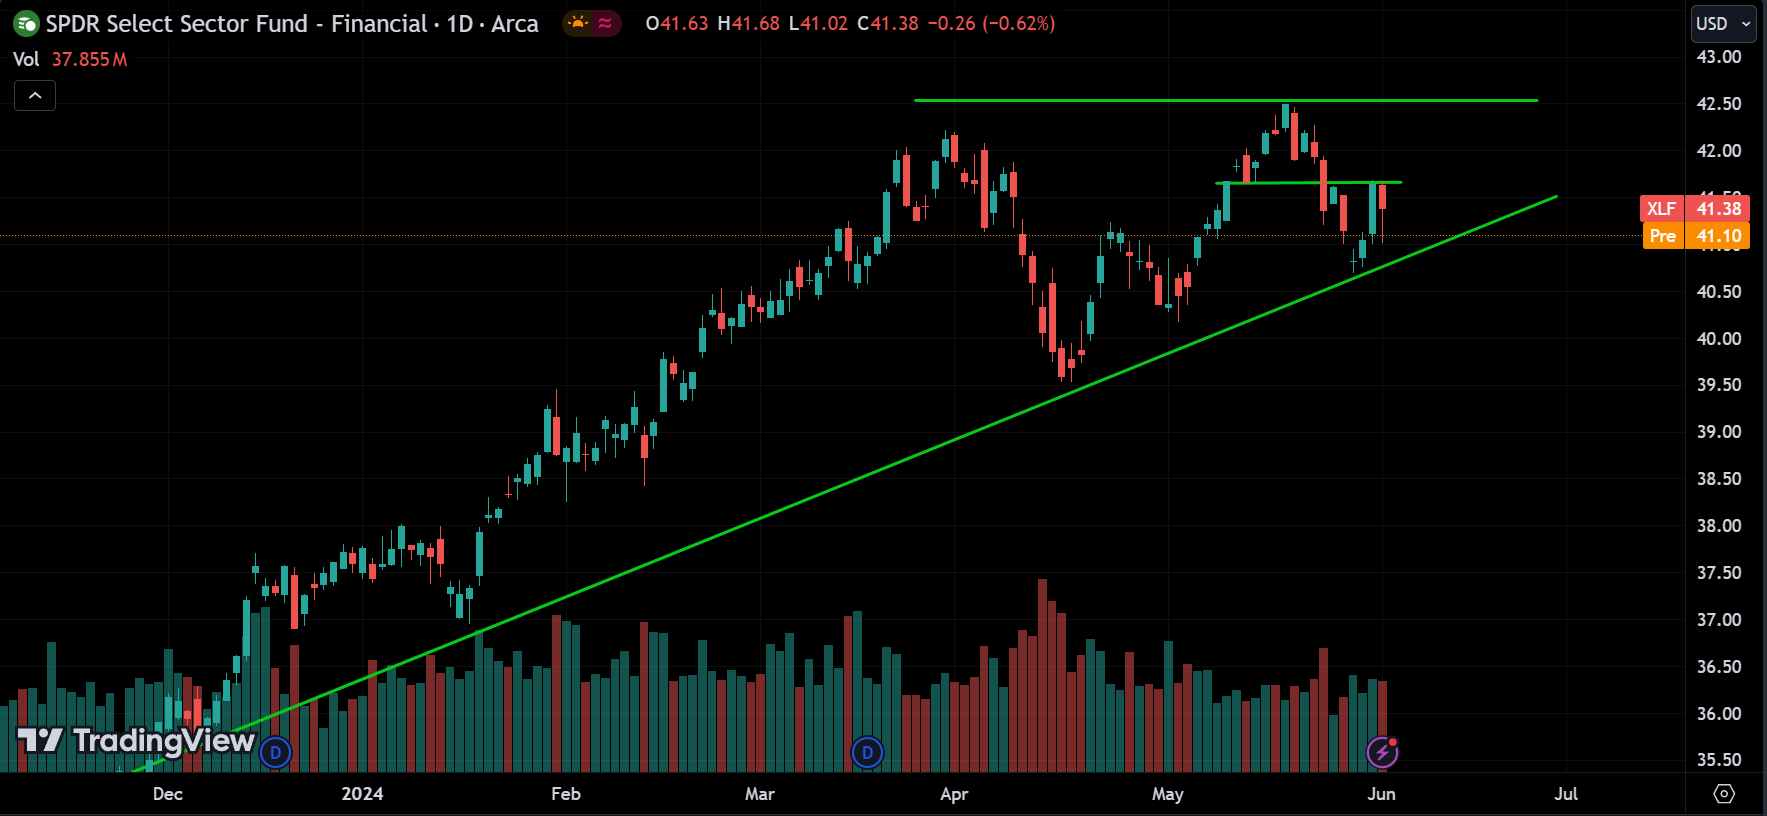
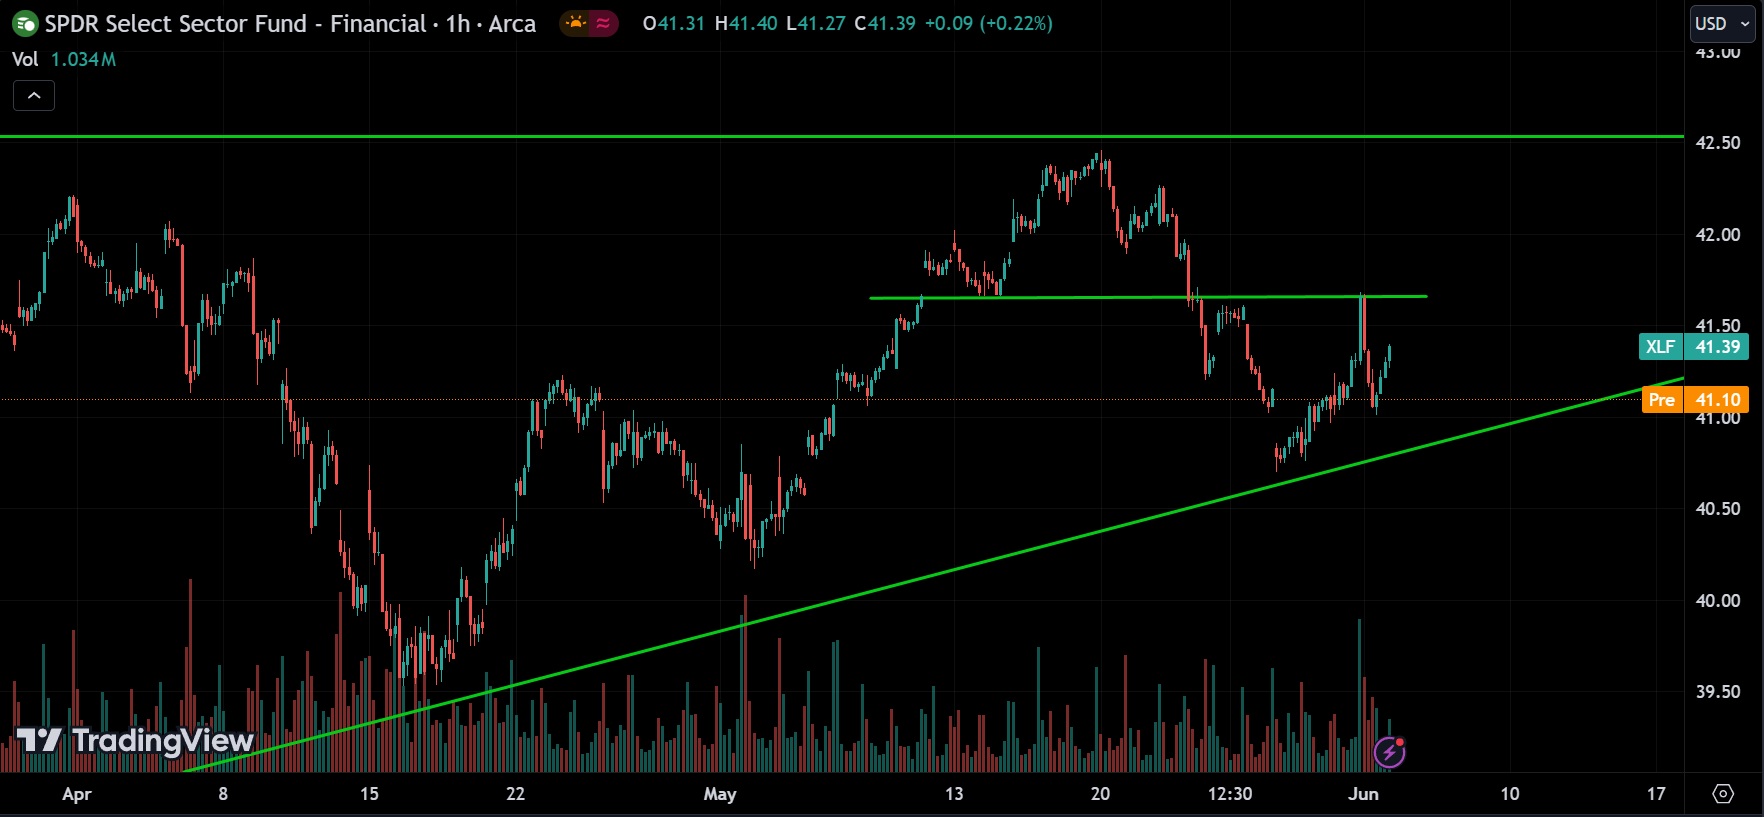
The financial sector is on an uptrend. On the 1-hour chart, the price started rising after hitting a low support level and then pulled back from resistance. We can expect the price to break this resistance and continue up to the 42.50 level.
Technology Sector:
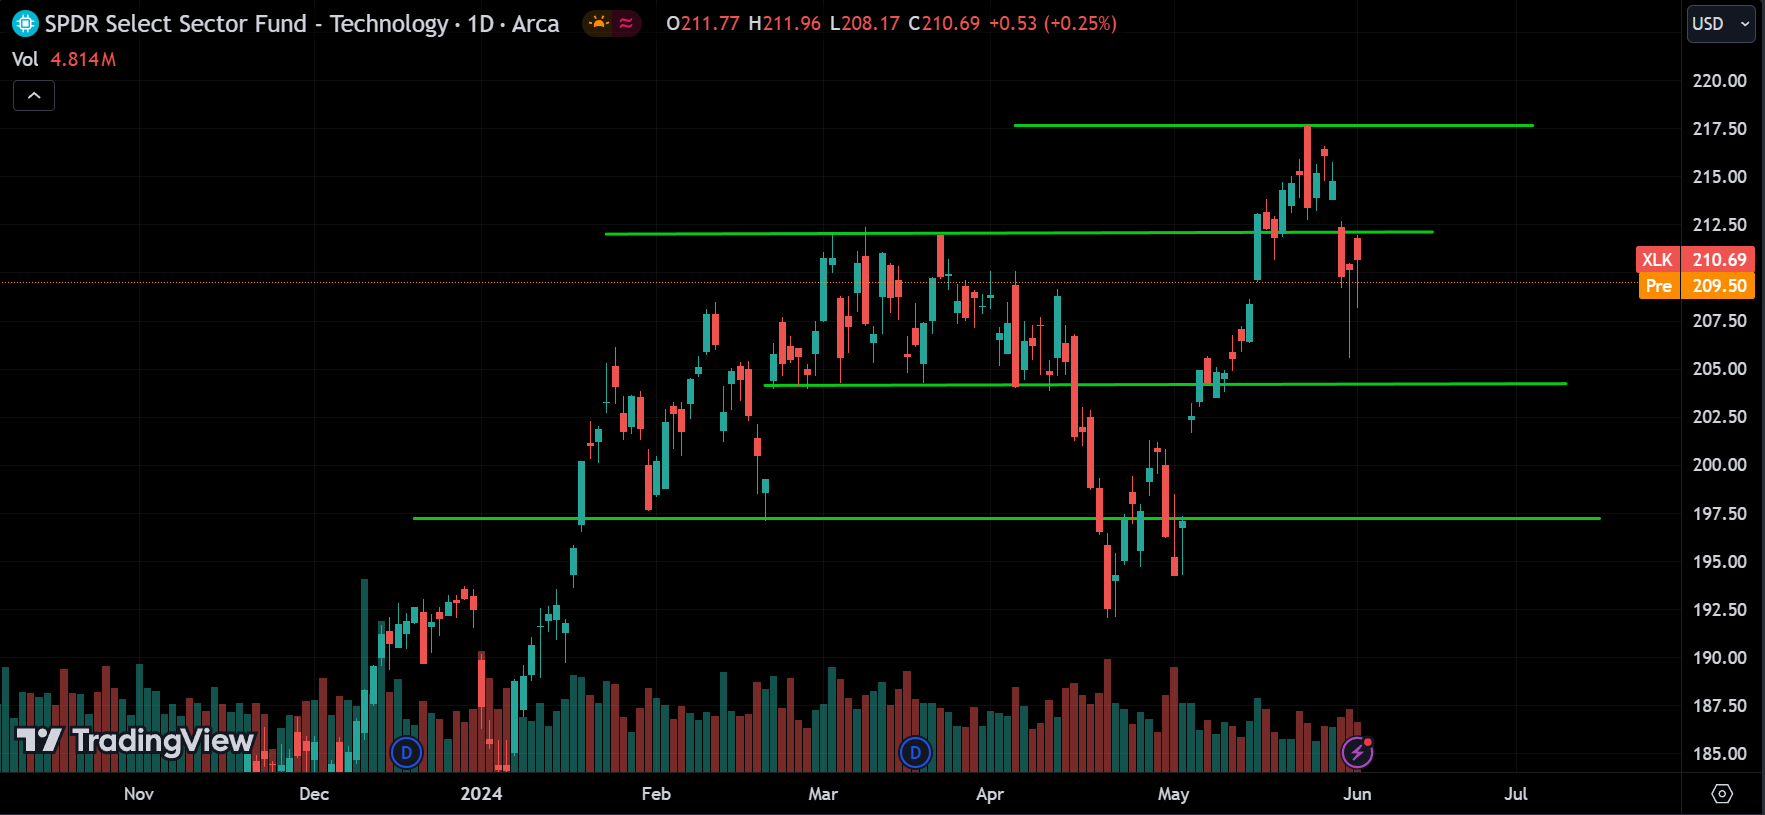
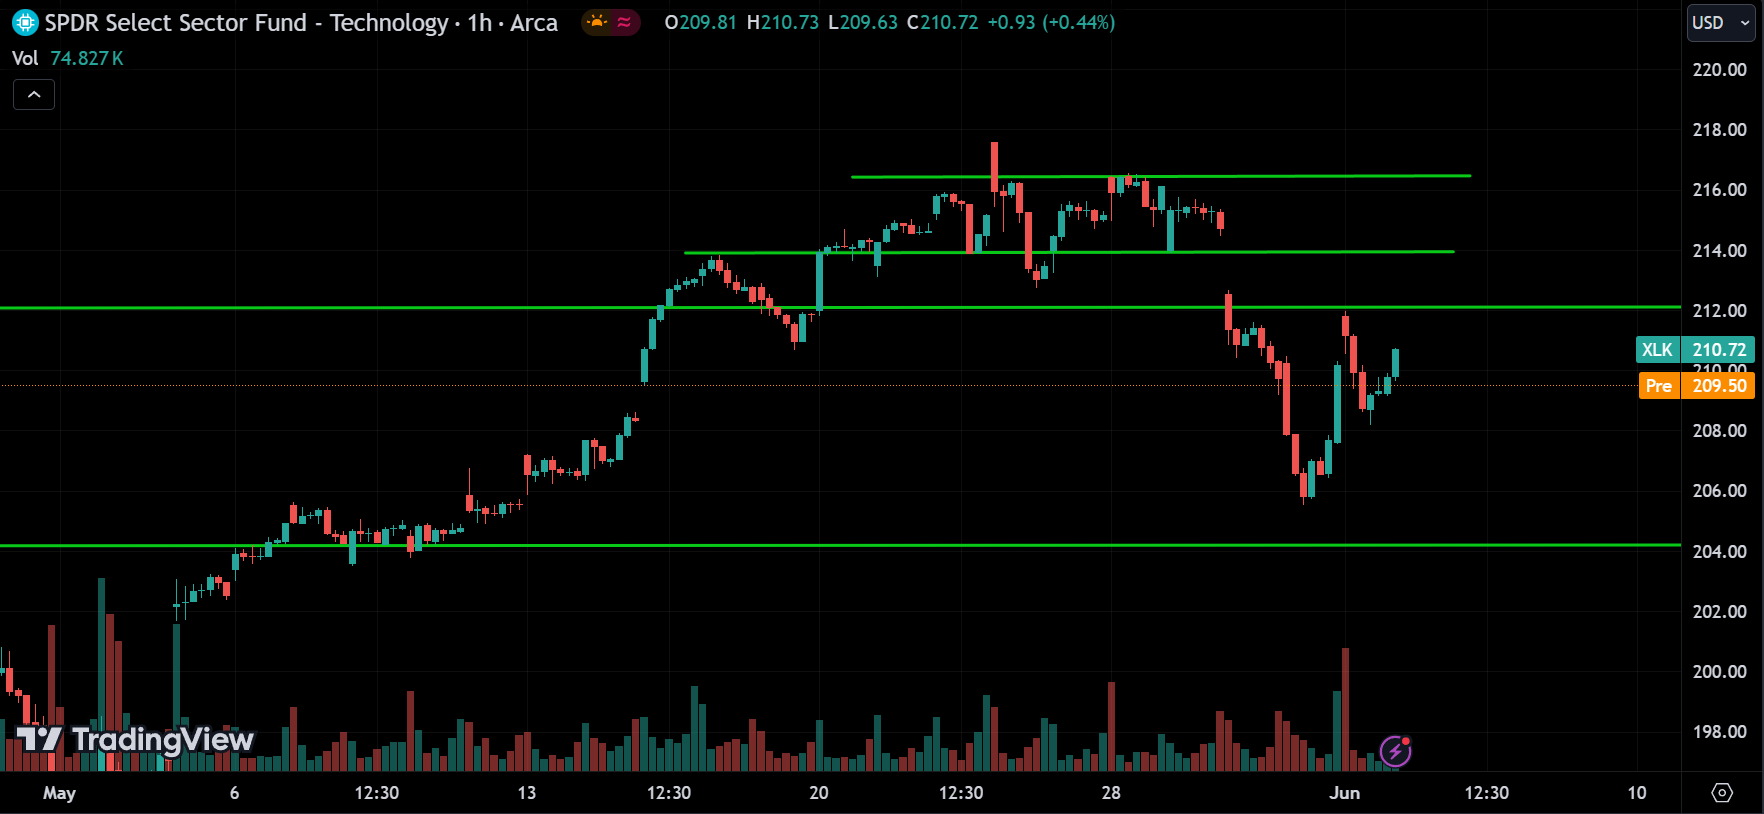
The overall trend for the technology sector is positive, but it appears to be correcting at the moment. On the 1-hour chart, you can see the price starting to rise again and hovering around a resistance level of 212. We can anticipate the price breaking above this level and continuing its upward trend, or it might fall from that point.
Communications Sector:
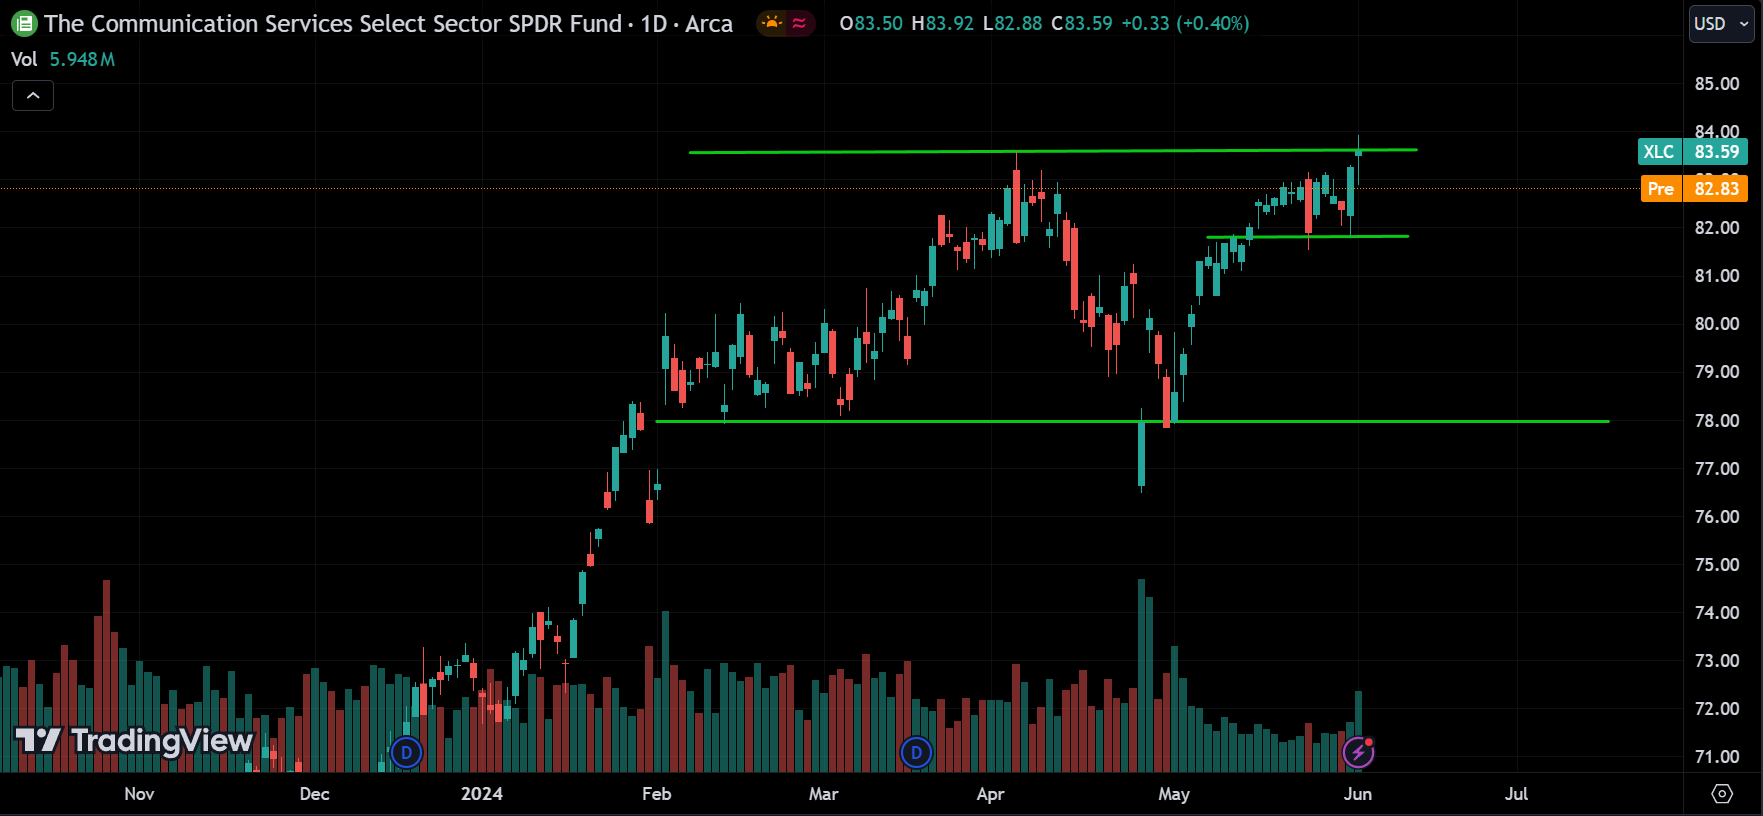
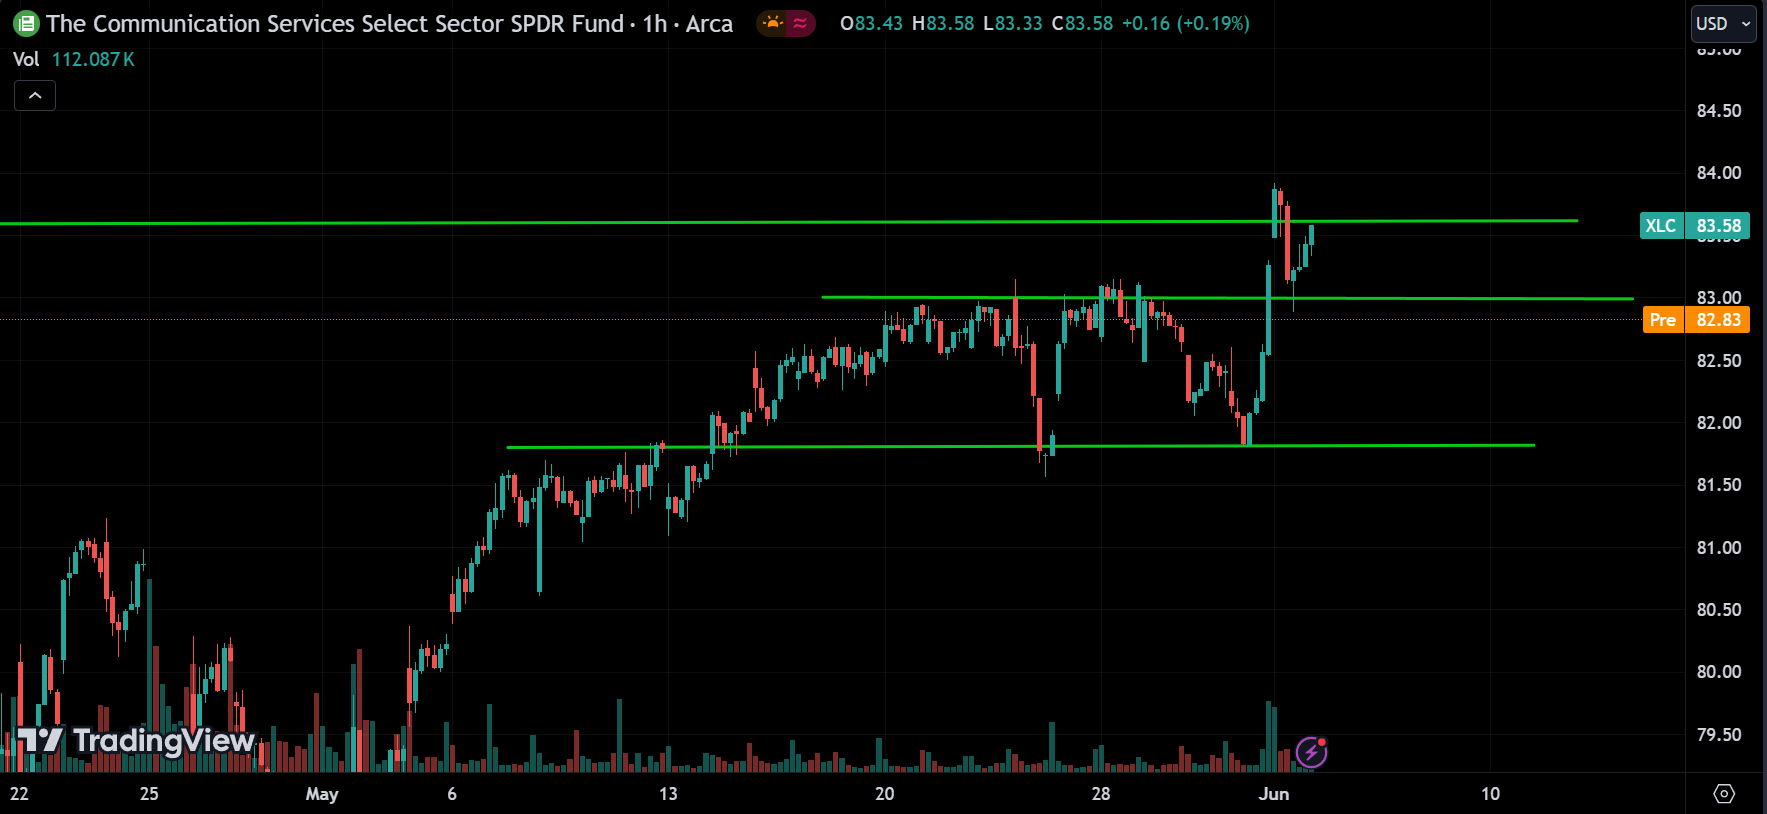
The communication sector is at its highest point, but it’s trading around its resistance level. On the 1-hour chart, you can see the price breaking the resistance but then pulling back down, indicating a fake breakout. However, the price is still moving in that direction. If it continues to rise and surpasses the previous high, then we can confirm the breakout is real, and we can expect the price to continue climbing.
Utility Sector:
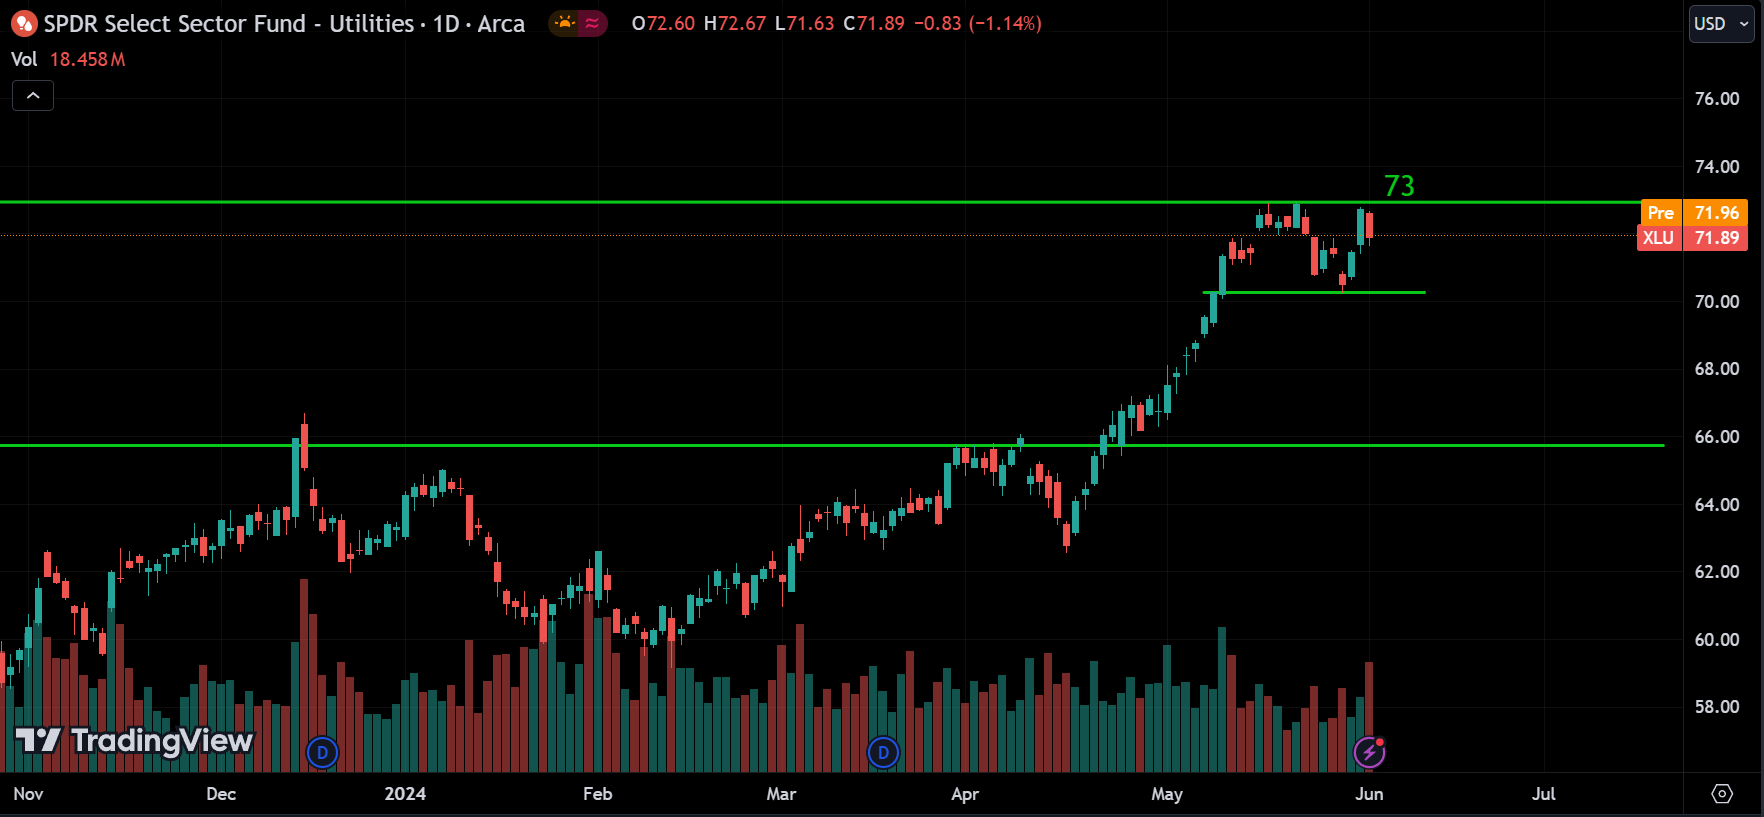
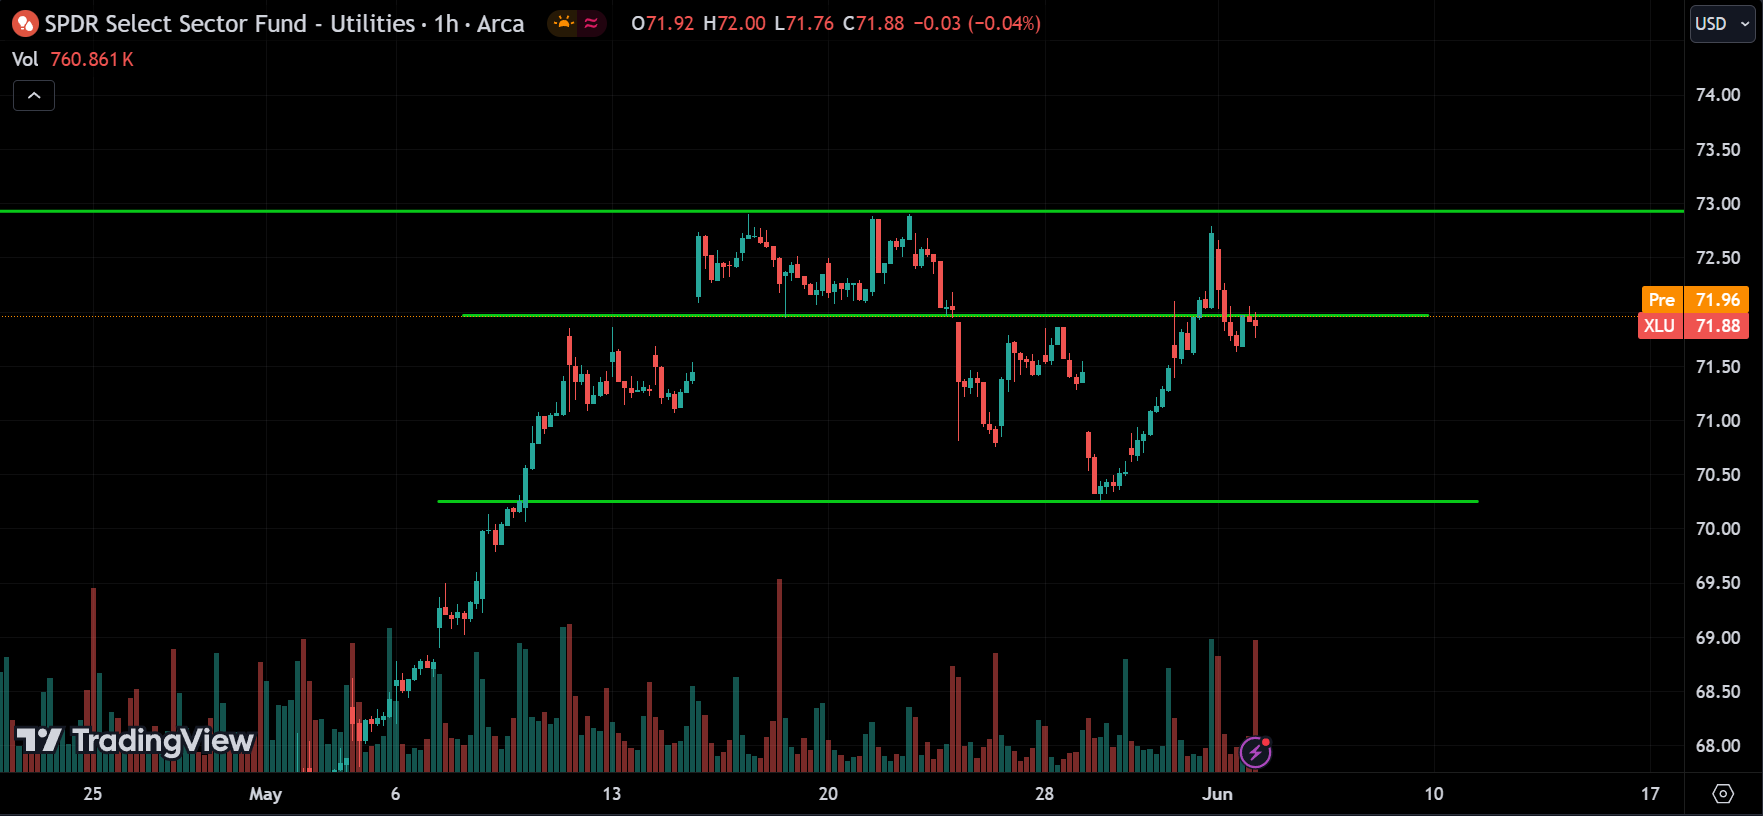
The utility sector is in a similar situation, moving sideways and trading near a resistance level of 73. We can expect either the price to break this level and keep rising, possibly with some corrections, or it could retreat from that point. On the 1-hour chart, you can see the price already in a pullback phase, trading around 72. We can expect it to rise from this level, or if it breaks down, it might drop to the 70 range.
Real Estate Sector:
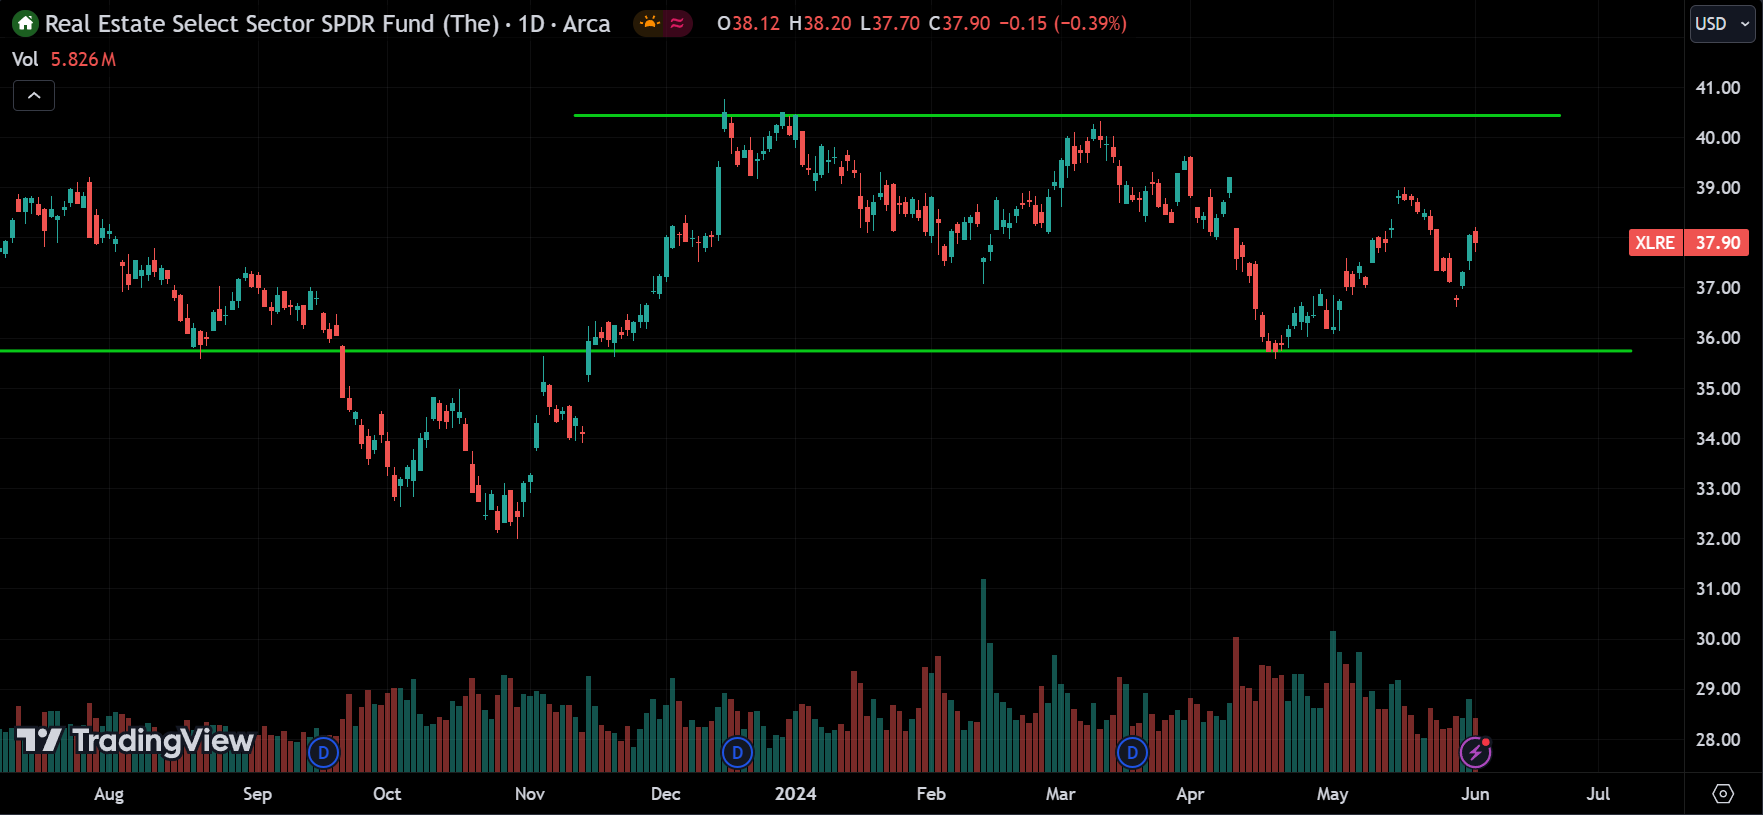
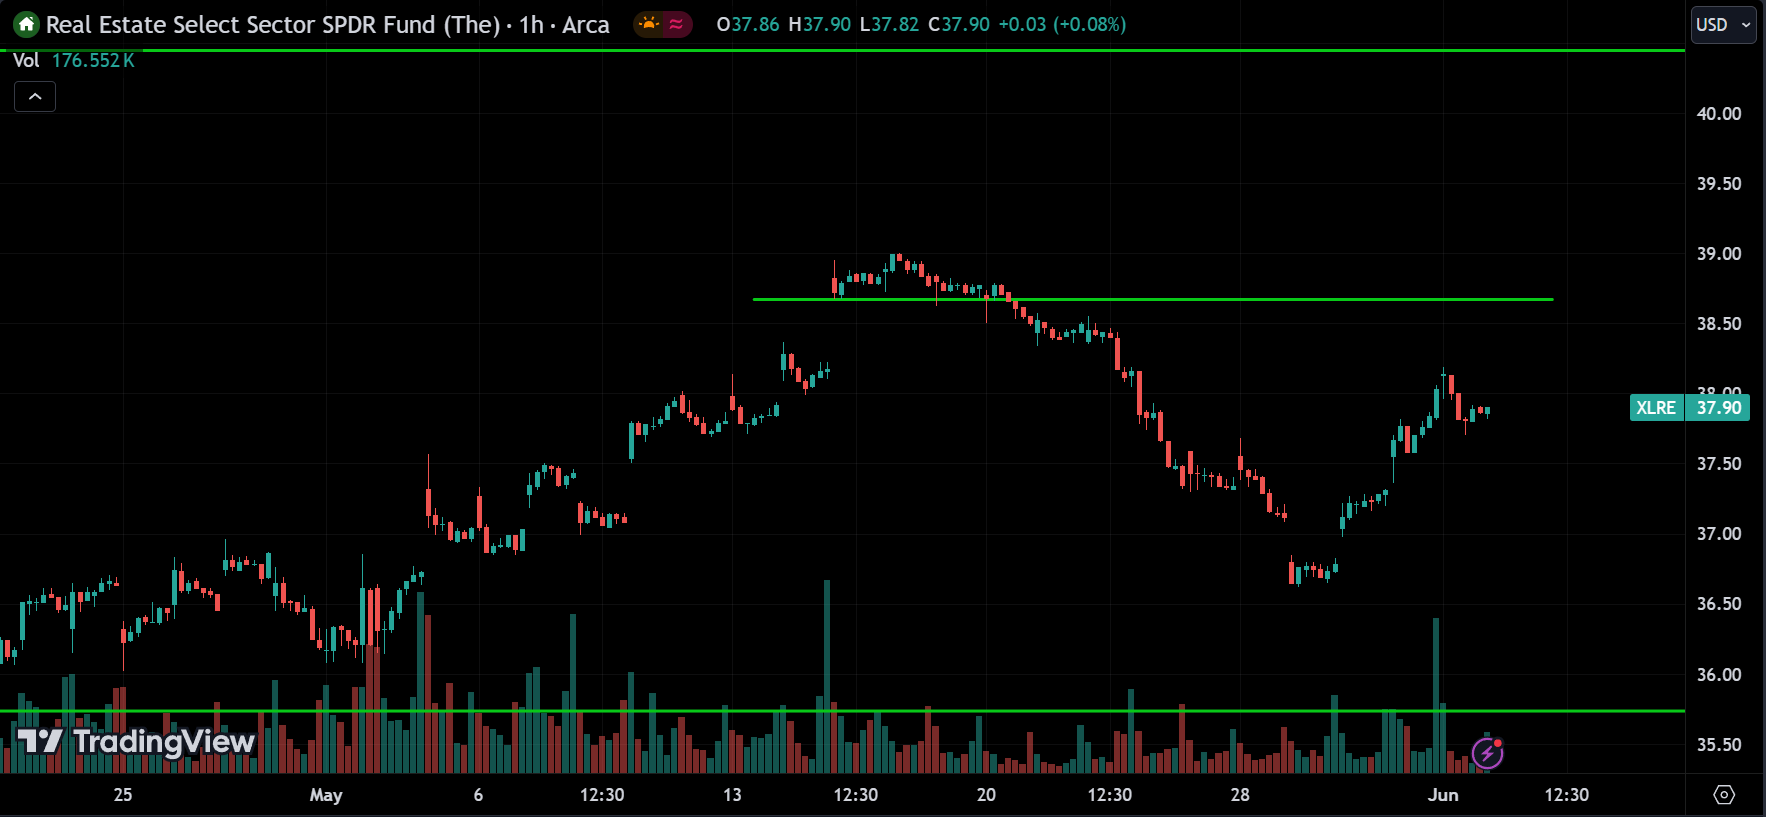
Taking a look at XLRE, it’s also moving sideways. The levels around 35.50 and 40.50 seem to act as good support and resistance. If you check the 1-hour chart, you’ll notice a resistance line around the 39 range. If this line is broken, we can anticipate XLRE to start moving upward. However, the price could also pull back from that level.
Disclaimer
The information provided in this market analysis is for educational and informational purposes only. It should not be construed as financial advice or a recommendation to buy, sell, or hold any securities or investments.
All investments involve risk, and past performance is not indicative of future results. The analysis provided may not be suitable for all investors and should be used at their own discretion.
These analyses are here to help you understand how to analyze the market. They’re not about giving buy or sell signals. It’s simply about observing market behavior. I don’t recommend when to buy or sell because trading doesn’t work that way. You need a strategy to guide your decisions about when to enter or exit positions. That’s the key to making consistent profits in the financial markets over time.
I discussed these sectors and markets because when the entire market or sector goes through certain movements, most of the stocks within that market will also experience similar movements. So, by understanding what the market is doing, you can conduct your own analysis on specific coins or stocks.
Readers are encouraged to conduct their own research.
Trading and investing in financial markets carry inherent risks, including the risk of losing invested capital. It is important to carefully consider your investment objectives, risk tolerance, and financial situation before making any investment decisions.
GOOD LUCK!!!