
In the dynamic world of financial markets, successful trading demands more than just a cursory glance at price charts. To gain a deeper understanding of market movements and to make informed decisions, traders often employ various analytical techniques.
One such powerful method is multi-time frame analysis (MTFA). By examining price action across different time frames, traders can uncover valuable insights into market trends, identify potential entry and exit points, and enhance the overall effectiveness of their trading strategies.
In this comprehensive guide, we’ll delve into the intricacies of multi time frame analysis and explore practical strategies for its implementation.
What is Multi Time Frame Analysis?
Multi-time frame analysis involves examining the same financial instrument across multiple time frames simultaneously. Instead of focusing solely on one time frame, traders analyze price data across different intervals, ranging from short-term to long-term.
The rationale behind this approach is to gain a comprehensive view of market dynamics, incorporating both macro and micro perspectives.
Time Frames in Multi Time Frame Analysis
There are three main kinds of time periods we use when doing multi-timeframe analysis. Let’s check them out.
Primary Time Frame:
The primary time frame serves as the anchor for analysis and typically represents the trader’s main trading horizon.
This could range from daily, weekly, or monthly charts, depending on individual preferences and trading styles.
The primary time frame provides the overarching trend direction and helps establish the broader market context.
Intermediate Time Frame:
The intermediate time frame offers a mid-range perspective, providing additional clarity on the prevailing trend and potential trading opportunities.
Common intermediate time frames include 4-hour, hourly, or 30-minute charts. Traders use this time frame to refine their entries and exits, aligning them with the primary trend identified on higher time frames.
Short-Term Time Frame:
The short-term time frame, often referred to as the lower time frame, involves charts with shorter intervals such as 15-minute, 5-minute, or even 1-minute increments.
While the primary and intermediate time frames provide the overall trend direction, the short-term time frame helps traders fine-tune their entries and manage intraday fluctuations effectively.
Benefits of Multi Time Frame Analysis
Comprehensive Market Perspective:
By analyzing price action across multiple time frames, traders gain a holistic view of market dynamics, encompassing both long-term trends and short-term fluctuations.
This broader perspective enables traders to make more informed decisions and avoid trading against the prevailing trend.
Enhanced Entry and Exit Timing:
Multi-time frame analysis facilitates precise entry and exit timing by aligning trades with the dominant trend identified on higher time frames.
By waiting for confluence across different time frames, traders increase the probability of successful trades and reduce the risk of premature entries or exits.
Improved Risk Management:
By incorporating multiple time frames into their analysis, traders can better assess the risk-reward ratio of potential trades.
They can identify key support and resistance levels, gauge market volatility, and adjust their position sizes accordingly, thereby minimizing losses and maximizing profits.
How to do Multi Time Frame Analysis?
Top-Down Approach:
The top-down approach involves starting analysis from the highest time frame down to the lowest.
Traders begin by identifying the primary trend on the higher time frame, then drill down to intermediate and short-term time frames to pinpoint potential entry and exit points that align with the broader trend direction.
Confluence of Signals:
Look for confluence or alignment of signals across multiple time frames.
For instance, if the primary trend is bullish on the daily chart, and there’s a bullish reversal pattern forming on the 4-hour chart, it strengthens the bullish bias and increases the probability of a successful trade.
Use of Technical Indicators:
Utilize technical indicators that are compatible across different time frames.
Common indicators such as moving averages, oscillators, and trend lines can be applied to multiple time frames to validate trading signals and confirm trend reversals.
Patience and Discipline:
Exercise patience and discipline when waiting for optimal trading opportunities.
Avoid the temptation to chase short-term fluctuations and prioritize trades that offer a high probability of success based on multi time frame analysis.
Example:
Now, Let’s delve deeper into a practical example to illustrate how multi time frame analysis can be applied in trading scenarios.
1. Determine the Primary Trend
Start by identifying the primary trend on a higher time frame chart, such as the daily or weekly chart.
This provides the broader market context and helps you understand the overall direction of the asset you are trading.
2. Zoom in to Shorter Time Frames
Once you have established the primary trend, move to shorter time frames, such as the 4-hour or 1-hour charts.
Analyze the price action and look for trends, support and resistance levels, and key chart patterns within the larger trend.
This allows you to identify intermediate-term trends and locate potential entry and exit points.
3. Confirm Trend Alignment
Check if the shorter time frame trends align with the primary trend. If the shorter time frame trend supports the primary trend, it increases the probability of a successful trade.
This confirmation adds conviction to your analysis.
4. Use Multiple Time Frames for Entry and Exit Signals
Look for potential entry and exit signals in the shorter time frames that align with the established trends.
For example, if you’re trading based on a daily chart trend, you can look for entry signals on the 4-hour or 1-hour chart that align with the daily trend direction.
When you spot a potential trade setup or receive a trading signal, it’s important to validate it across multiple time frames.
If the signal aligns with the trends and support/resistance levels in different time frames, it increases the probability of a successful trade.
5. Time your Entries with Precision
Utilize shorter time frames, such as 15-minute or 5-minute charts, to time your entries more precisely.
Wait for a favorable entry point based on the established trends and technical indicators in these shorter time frames.
6. Continuously Monitor and Adjust
Keep monitoring the price action across multiple time frames as the trade progresses.
If the higher time frame trend begins to show signs of reversing, it may be time to exit the trade or tighten your stop-loss. and this depends on your strategy.
Example:
Traders commonly utilize daily, 1-hour, and 15-minute timeframes as their preferred intervals, and they employ 3-minute and 5-minute charts for entering positions or timing their entry points.
Employing multiple time frame analysis proves advantageous for trend trading or capitalizing on momentum opportunities.
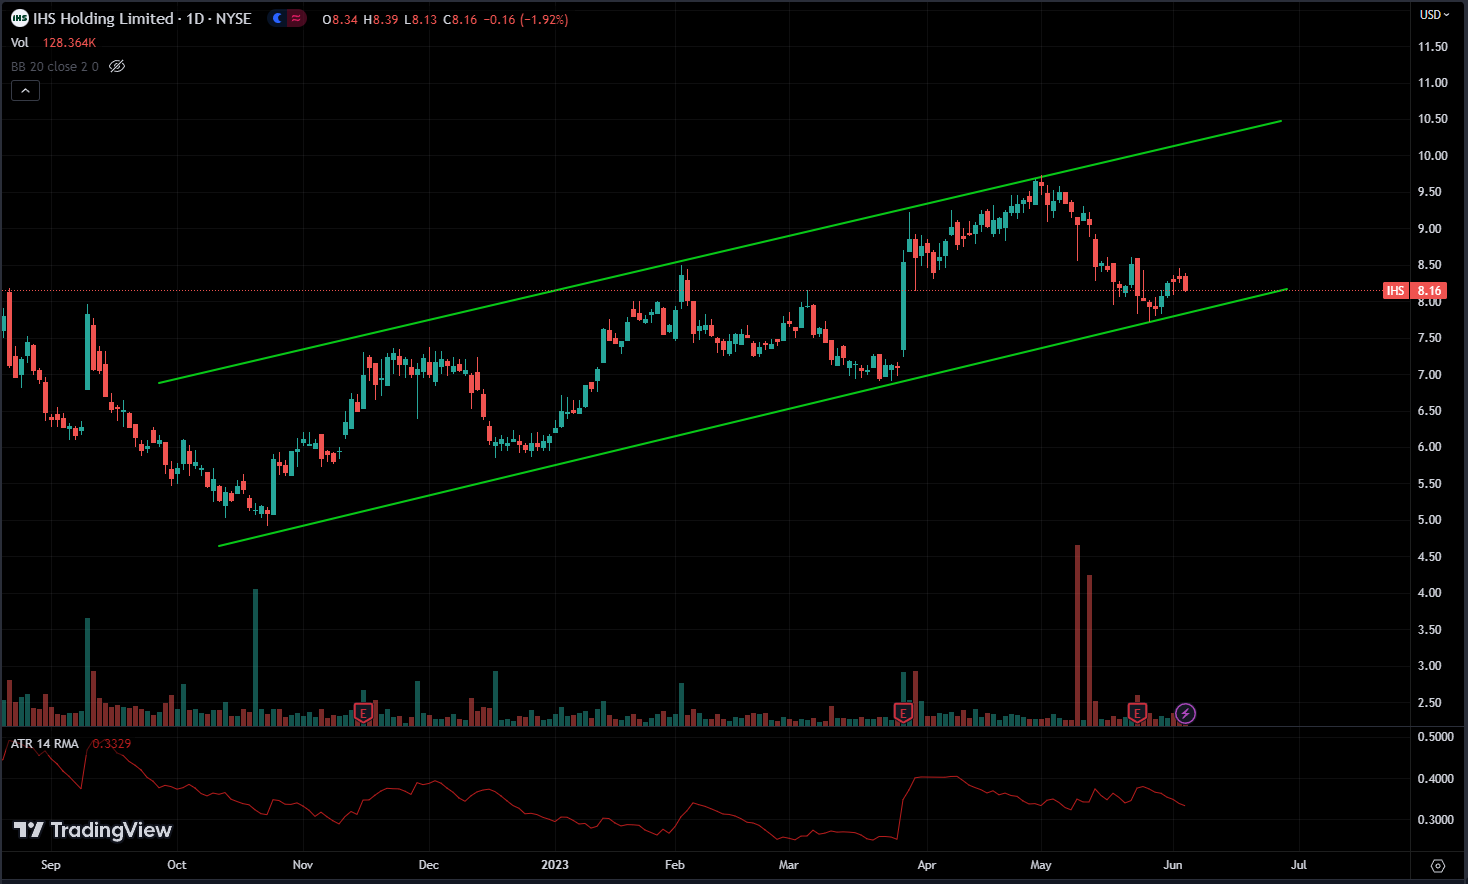
For example, suppose you analyze a stock that shows an uptrend on the daily chart. Based on the widely accepted belief in trading that trends have a tendency to persist, you have confidence that the trend will continue. Moreover, this aligns with your trading strategy, further motivating you to buy that particular stock.
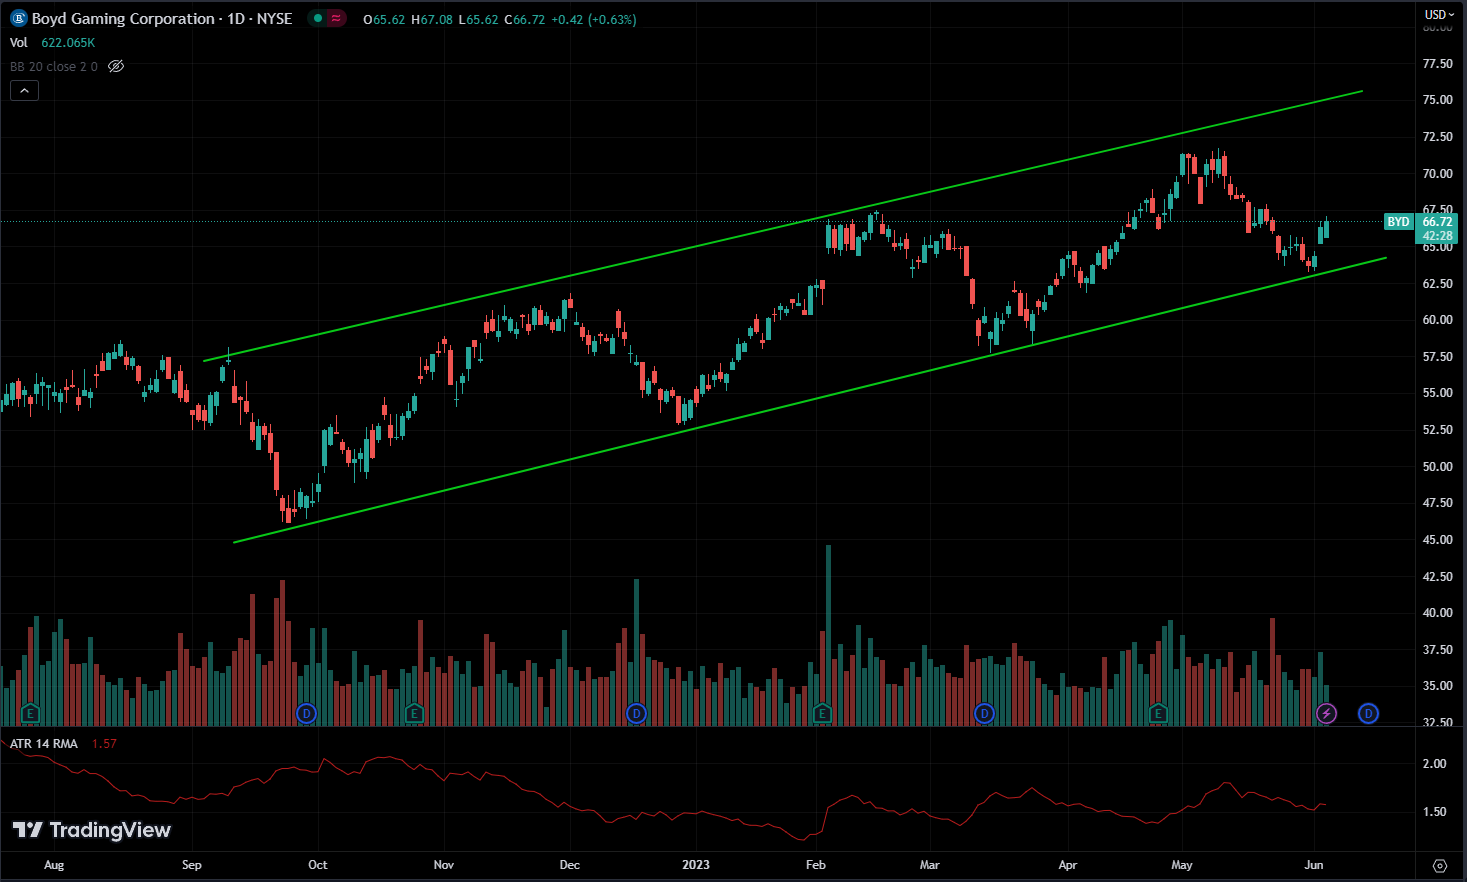
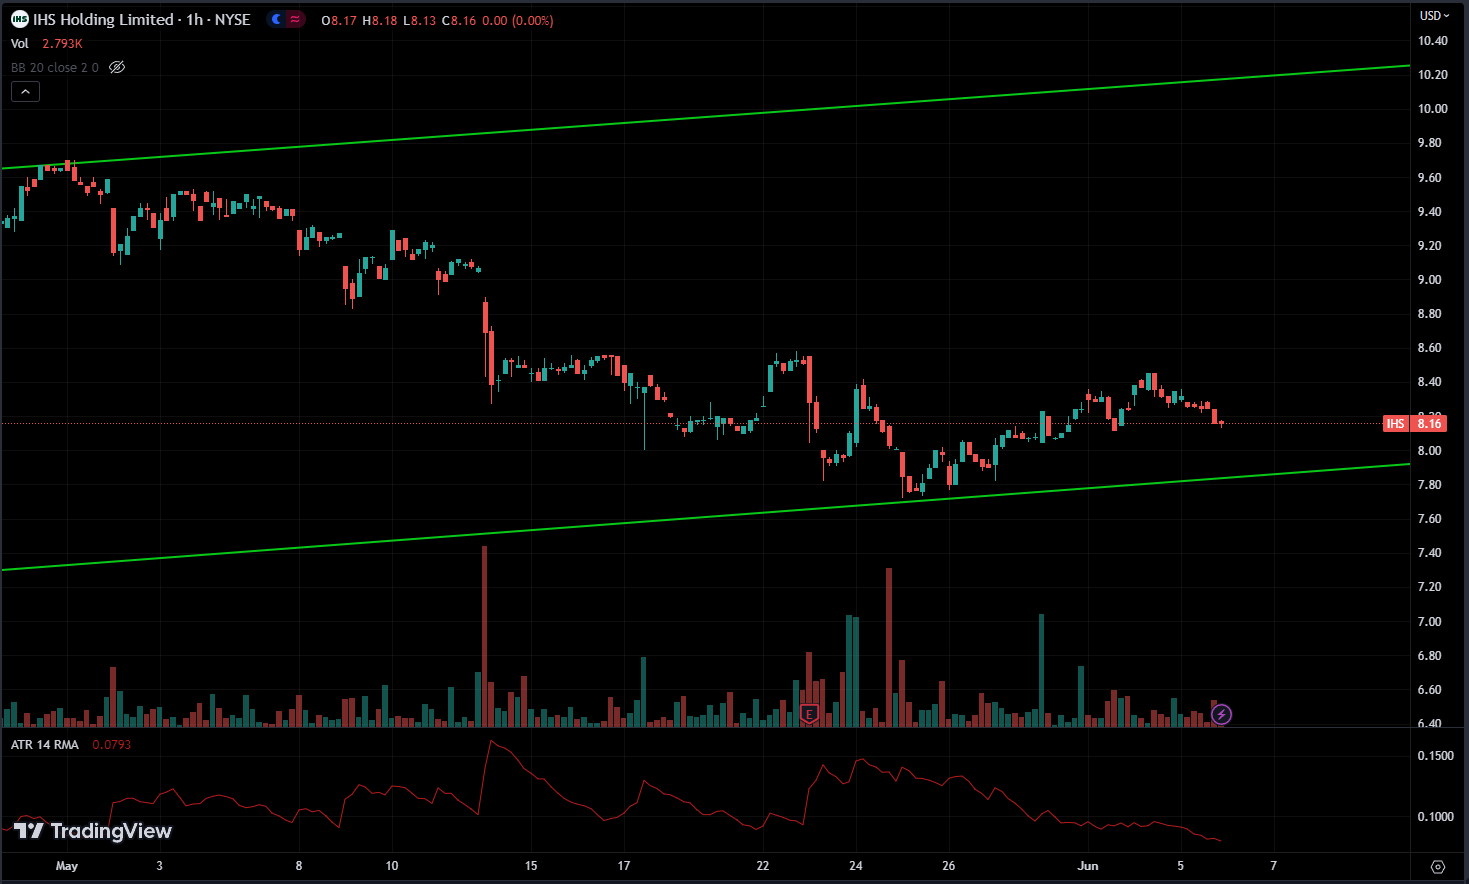
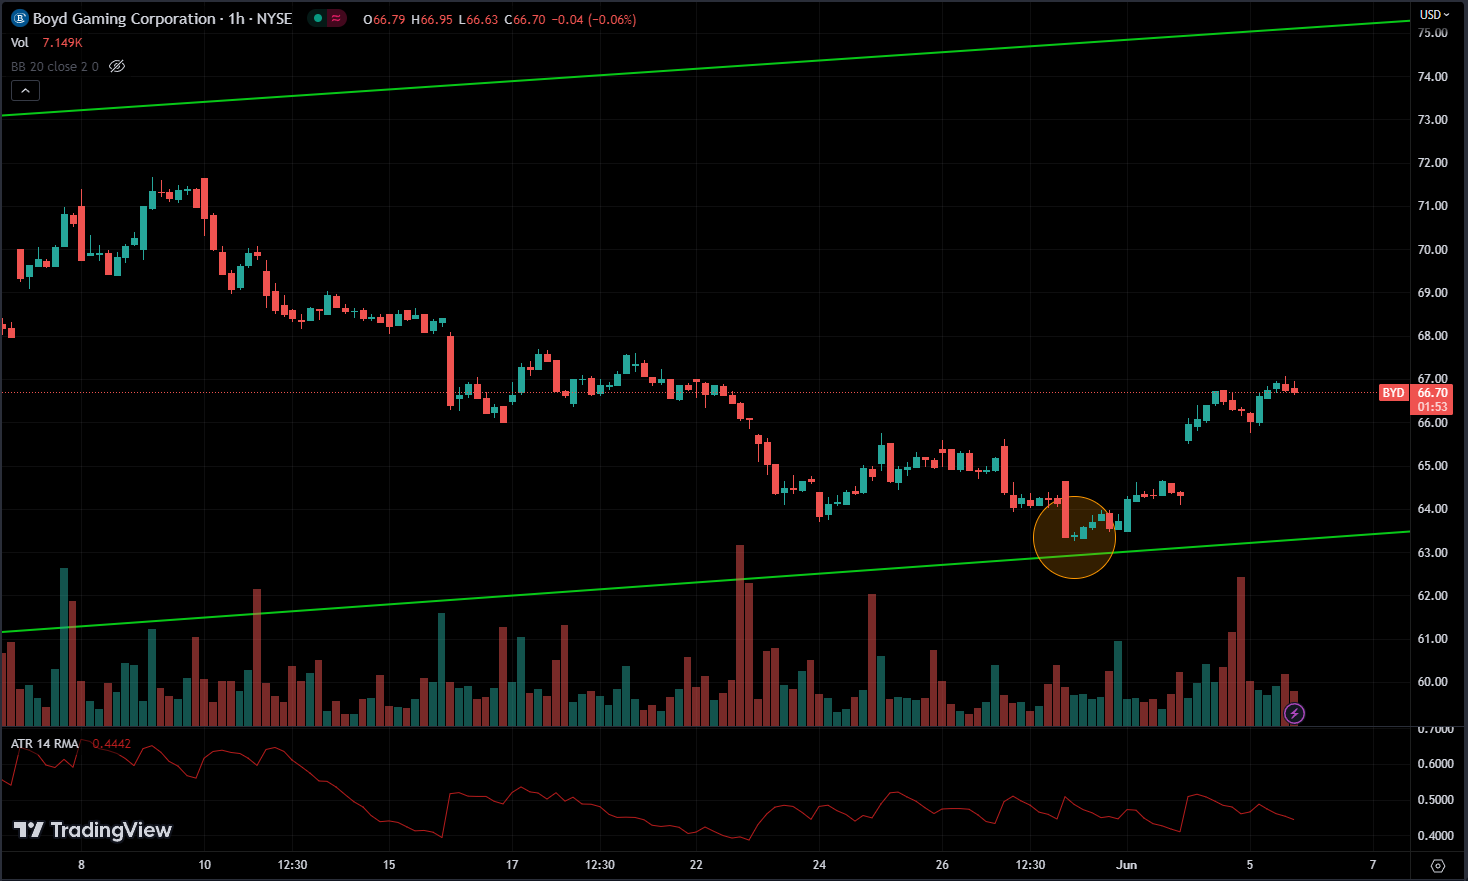
But you want to buy the stock at just the right time to avoid any sudden fluctuations. So, you use a shorter time frame, like 1 hour, 15 minutes, or even 3 minutes, depending on how you trade, to help you do this.
In this particular example, the 1-hour charts appear favorable.
Given that the price has already reached a support level and is currently moving within a channel, you might decide to buy when you see a signal that suggests the trend reversal at that support line.
In the beginning, the daily chart didn’t show any clear signs of a reversal happening. It looked more like a doji candlestick pattern, indicating indecision.
However, if you zoom in by switching to a lower time frame,
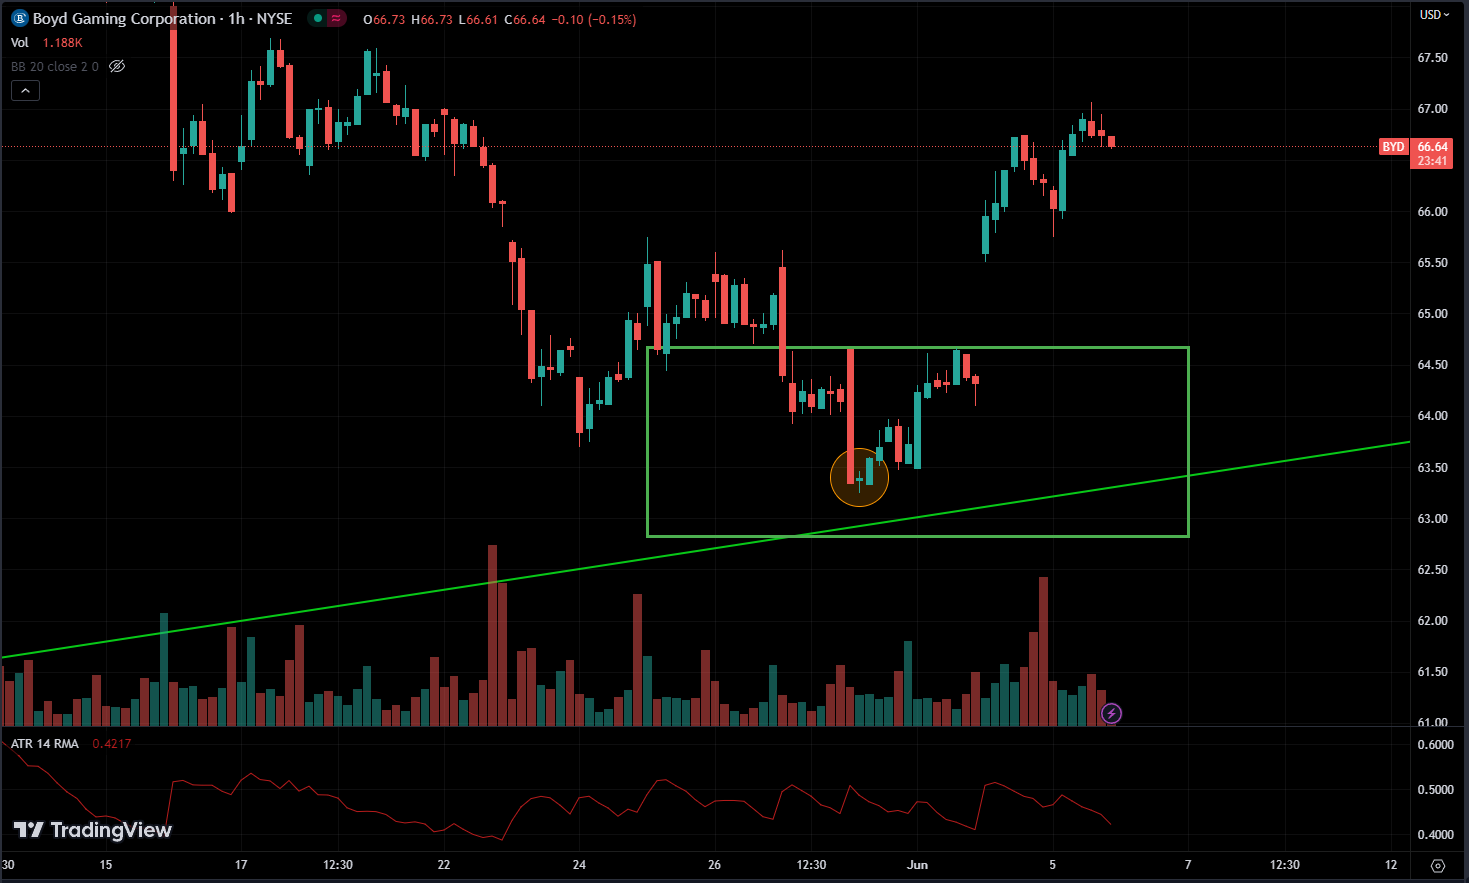
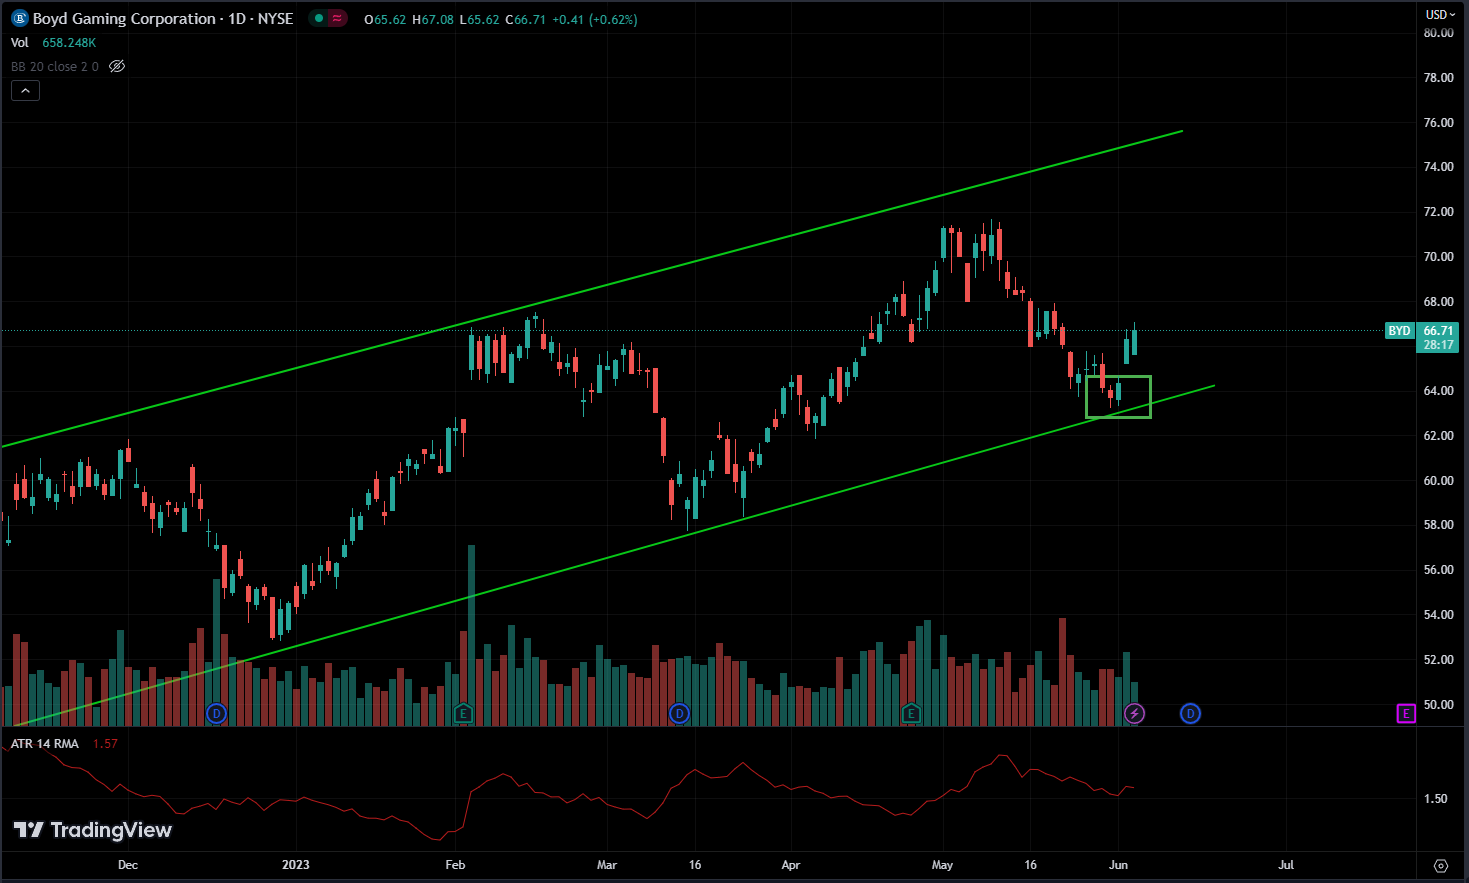
If you check the rectangle area on the daily chart, you’ll see only one green candle within that range. But if you switch to the 1-hour chart, you’ll get a better idea of what happened during that one daily candle because the 1-hour candles give more detailed information.
The rectangle I drew on the daily chart remains unchanged.
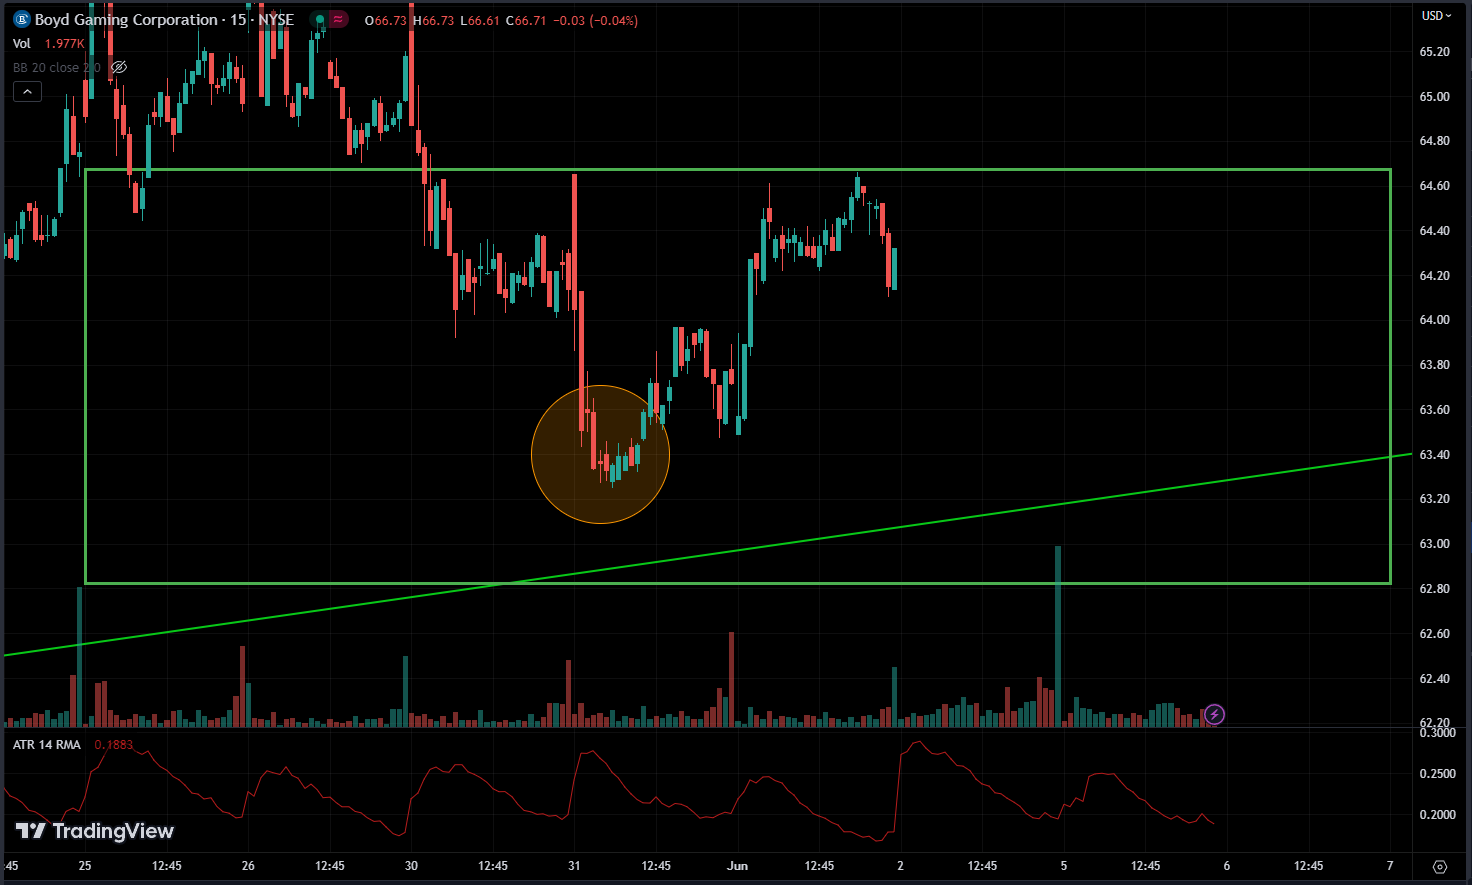
Now, If you go even deeper into the 15-minute chart, it will appear as follows.

While the larger timeframes provide a comprehensive understanding of the overall trend, the smaller timeframes assist in identifying retracements and corrections within that trend.
Conclusion
To sum up, using different time periods to study trading has many benefits. By looking at charts for different lengths of time, like daily, hourly, and 15-minute ones, traders can really understand how the market moves.
As said earlier, bigger time periods show the overall trend, while smaller ones help spot possible changes within that trend. This lets traders decide when to enter or exit trades wisely, making the most of opportunities and managing risks better.
But remember, multi-timeframe analysis is just one tool among many for traders. It’s not enough to base all your decisions on comparing two timeframes.
Having a clear plan for when to buy and sell is key. While multi time frame analysis can be part of that plan, it’s not the whole strategy.
If your plan says it’s time to buy, multi-timeframe analysis can help you find the best time to do it.